
Market Updates
2025
+ to expand, - to collapse
Market Update:
TBD
2024
Market Update: December 2 - 6, 2024

Weekly Summary
Stocks increased last week and have risen nearly 30% in 2024 as interest rates have moderated and earnings growth has been robust. The November payroll report on Friday did little to move markets, as the numbers were mostly in-line with expectations. With just three weeks left in the year, there are still many important data points such as the Federal Reserve’s expected interest rate cut, further details on Trump’s tariff plans, and two more inflation prints.
Economic Data
Payrolls for November increased by 227,000 while the unemployment rate increased to 4.2%. The report was overall mixed, with no aspect of the report showing strong signs of surprise in either direction. With unemployment hovering near 4% and inflation near 2%, the US economy remains in a goldilocks zone of high growth, low inflation, and decreasing interest rates.
Equities
The S&P 500 is now up nearly 30% in 2024, which would make this the strongest year for markets since 2019 when the S&P 500 returned 30.7%. Small-caps failed to make up lost ground but have still returned a very strong 20% this year while growth yet again leads the way in the S&P 500 with a YTD return of 39% through December 6, 2024. Nvidia has led the way, but has shown signs of slowdown and is currently down more than 3% on Monday, December 9 as it was announced that China has begun investigating the company for monopolistic practices.
Fixed Income
Interest rates remain relatively stable as markets predict another rate decrease at the Fed’s meeting next week. Interest rates have stabilized after the Fed’s policy path became clear, and economic data has offered very little surprise in recent months which further cements the future path of interest rates for the time being. Absent an inflation or unemployment shock higher, the Federal Reserve is expected to continue decreasing interest rates throughout 2025.
Interesting Articles
Market Update: November 11 - 15, 2024

Weekly Summary
The past two weeks have been eventful, marked by pivotal political and economic developments that influenced markets. A list of those events and their impact is below:
- Election Results: In the U.S. presidential election on November 5, Donald Trump won the presidency with 312 electoral votes, flipping key battleground states such as Arizona, Georgia, Michigan, Pennsylvania, and Wisconsin. The Republican Party also retained control of the Senate and gained a slim majority in the House, signaling a unified government.
- Federal Reserve Rate Cut: Following the election, the Federal Reserve reduced interest rates by 25 basis points to support economic growth amid moderating inflation. This was the second rate decrease of this cycle, and it is expected that the Federal Reserve will reduce interest rates by another 25 basis points at their December meeting.
- Key Economic Data:
- Inflation: October CPI showed inflation stabilizing at 2.4% year-over-year, while PPI data indicated limited price pressures in production, easing concerns of persistent inflation.
- Consumer Spending: October retail sales rose 0.3%, signaling steady consumer activity as the labor market remains robust.
- Market Performance: Since November 6, the S&P 500 total return index has gained approximately 4.1%. Tech and consumer discretionary sectors led gains, while financials lagged amid declining yields. Optimism around stable inflation, solid consumer activity, and accommodative monetary policy has fueled investor sentiment.
- Interest Rates: Interest rates across the curve have increased over the past month, and the 10-year is now hovering close to 4.5% despite 75 basis points of cuts from the Fed over the past two months. Interest rates increased following the election, as inflation fears have restarted in the bond market due to the proposed tariffs by the Trump administration.
Interesting Articles
Market Update: October 28 - November 1, 2024

Weekly Summary
Interest rates increased and stocks fell after a confusing week of economic data, but all eyes are focused on the week ahead as this week includes two major events. The election on Tuesday will capture the country’s attention this week, but the stock and bond markets will be much more focused on the Federal Reserve’s Wednesday meeting. Interest rates have increased since the Fed’s September meeting, which is certainly an unwanted sign, so they will likely use this meeting to clarify future policy. Markets currently expect a small 25 basis point cut on Wednesday.
Economic Data
Headlines can be deceiving, and that is the case for this week’s batch of economic data. On the surface, it appears that the economy just had one of its weakest employment reports in recent history. The economy added just 12,000 jobs last month after adding more than 200,000 in September. While this would initially appear negative, there are two jor factors that affect this number. First, a temporary strike at Boeing is included in this figure and includes job losses of more than 40,000 employees, but these losses are temporary and will be added back into the employment figures once the strike is resolved. The second impact to the figure is the two major hurricanes that impacted the southeast during October. The BLS noted that it is “not possible to quantify the net effect” of the hurricanes on the economic data, but it does indeed affect the data.
Equities
The S&P 500 fell by 1.4% last week as interest rates continued increasing after the Federal Reserve’s September rate decrease. The Nasdaq fell by 1.6% as Nvidia fell by nearly 5%. One of Nvidia’s largest competitors, Super Micro Computer, came under intense scrutiny last week as its auditor, Ernst & Young, raised significant concerns about its financial statements and removed itself as auditor of the company. The suspected fraud rattled the highly competitive artificial intelligence industry, and artificial intelligence stocks across the country fell in tandem with Super Micro, which dropped by 45%.
Fixed Income
Interest rates increased once again last week despite the weak economic data as the Federal Reserve looks to lower interest rates again this week. The Fed meets on Wednesday, and markets currently expect a 25 basis point rate decrease. The recent rate spike may prompt the Federal Reserve to reconsider its current plans, but all market participants expect a small 25 basis point cut at this meeting, with no expectation for a larger cut.
Interesting Articles
Market Update: October 15 - 21, 2024

Weekly Summary
It was a light week of economic data, as markets shifted their focus towards the third quarter earnings season for publicly traded companies. Earnings have so far been positive, with profit margins increasing again for the S&P 500. Markets will focus on the third-quarter GDP report, set for release on Wednesday morning, along with ongoing earnings releases over the next few weeks as we approach Election Day.
Economic Data
It was a mixed week for economic data, with building permits, durable goods, and existing home sales offering little insight into the state of the economy. The Atlanta Fed’s GDPNow real-time measure of third-quarter GDP indicates that the economy is expected to grow by 3.3%, substantially above the long-term average of 2% GDP growth. Third quarter GDP growth will be announced on Wednesday, October 30.
Earnings Season
Publicly traded companies began reporting their third-quarter earnings results over the last few weeks, and nearly half of all S&P 500 companies have reported to date. The expected earnings growth rate for the quarter is 3.6%, which would be the fifth straight quarter of earnings growth for the index. Notably, profit margins have been expanding again, and the third quarter appears likely to mark the second straight quarter of S&P 500 profit margins above 12%. The last time this occurred was in Q1 and Q2 of 2022, at the beginning of the significant inflation spike that led S&P 500 companies to dramatically increase their profit margins.
Commodities
Crude oil dropped by more than 6% early Monday morning after Israel’s attack spared Iran’s energy facilities. On Saturday, Israel launched three separate attacks against Iran, but all seemingly spared the country's energy production facilities, which eased market fears of a temporary decline in global crude oil supply.
Interesting Articles
Market Update: September 30 - October 4, 2024

Weekly Summary
The September employment report was the highlight of the week, causing inflation fears to re-emerge as job gains were much better than expected. This caused the yield curve to increase across the board, and a slight inversion has taken hold again, with the 2-year yield currently one basis point higher than the 10-year yield. Markets will be laser-focused on the CPI report scheduled to be released on Thursday. An upside surprise in inflation, paired with the strong jobs number, could lead to renewed market concerns about another spike in inflation on the horizon.
Economic Data
The September jobs report was universally positive, as all aspects of the release were stronger than expected. Nonfarm payrolls grew by 254,000 in September, the highest monthly gain in six months, and the unemployment rate decreased to 4.1%. Average hourly earnings also exceeded expectations. Kathy Jones, the chief fixed income strategist for Charles Schwab, said, "It was 'wow' across the board… The bottom line is it was a very good report."
Equities & Fixed Income
Stocks were mixed last week as better-than-expected economic data sparked fears that the Federal Reserve might not be able to reduce interest rates as quickly as initially expected. A stronger-than-expected economy could lead the Fed to believe that there is upside risk to inflation, which would prompt them to keep interest rates higher than current expectations. This move could lead to a continuation of the trend from the past two years, where an inverted yield curve disproportionately affects small-cap companies in favor of large-caps. It would also keep short-term interest rates elevated and in restrictive territory, limiting the Federal Reserve's ability to be as accommodating to the economy and stock market as they might prefer.
Commodities
Tensions in the Middle East increased significantly last week after Iran escalated the conflict in Israel. This escalation led to a steady rise in oil prices, bringing them back into the $70-per-barrel range, with further increases possible if the conflict continues to escalate.
Interesting Articles
Market Update: September 23 - 27, 2024

Weekly Summary
It was a light week for economic data, as the third quarter ends today with a gain of roughly 5%, despite a 10% sell-off in August. Following a sharp decrease in interest rates, the dollar weakened as expected, and the yield curve has normalized. When combined with decreasing oil prices and rising stock prices, these factors create a market environment that could be described as a Goldilocks scenario.
Economic Data
Second quarter GDP was finalized last week, and the economy officially grew by 3% in the quarter. This is an exceptionally strong late-cycle growth rate, as the medium-term average has hovered around 2%. Markets will quickly shift their attention to the September employment report, which will be released on Friday and will be the first major economic data point since the Federal Reserve cut rates two weeks ago.
Equities
The S&P 500 has now increased more than 20% in 2024, more than double its average annual gain and currently sits at a new all-time high for the index. This 20% gain through the first three quarters marks the best start to a year since 1997 and is among the best in stock market history. At current levels, the S&P 500 is now above every Wall Street year-end price target for 2024, which underscores just how surprising this rally has been.
Fixed Income
Interest rates have firmly normalized after years of inversion, and the 2-year yield remains near recent lows at 3.61%. The Federal Reserve is hopeful that the decrease in Treasury rates will begin to impact the housing market, where buyers have been stalled by historically high mortgage rates. The Fed hopes that lowering mortgage rates will unlock buyers and sellers in the housing market, providing some much-needed relief to the industry.
Interesting Articles
Market Update: September 16 - 19, 2024

Federal Reserve Decreases Interest Rates
Jerome Powell took decisive action on Wednesday, announcing a 0.50% cut in the Federal Reserve’s overnight interest rate. Prediction markets had been unsure on the direction of the Fed, and the last few weeks have been an endless debate between a 25 or 50 basis point rate increase. Powell chose an aggressive approach to start the cycle, and markets reacted immediately.
The S&P 500 hit new all-time highs on Tuesday, finishing the week up 1.4% and bringing its total 2024 gain to over 20%. The small-cap S&P 600 index saw a larger 2.3% increase following the rate cut. Small-caps have underperformed large-caps for the past three years as higher interest rates have disproportionately hurt smaller companies compared to larger companies. Small-caps began rallying as expectations for Fed rate cuts solidified. The S&P 600 has increased 6.5% over the last two weeks, compared to 3.5% for the S&P 500. While the large-cap S&P 500 is at new all-time highs, the S&P 600 is still 3% below its all-time high.
Another interesting market move surrounding the Fed’s decision was in interest rates. While interest rates have been moving lower for quite some time, the last two weeks saw the return of a normalized yield curve for the first time in years. The short-term rate finally moved below the long-term rate, as the 2-year hit its lowest level in two years. An inverted yield curve has historically preceded a recession. However, this inversion has been the longest on record without a recession, and the economy is showing no signs of slowing down. While the unemployment rate has increased over the last few months, the Atlanta Fed GDPNow Q3 estimate shows the economy growing at 2.9%, which is substantially higher than the 2% average.
The Federal Reserve’s rate cut was not a response to an impending recession. They decreased the interest rates because inflation has finally fallen back to their target range, and they have started to see some slight weakness in the labor market. Overnight interest rates were above 5%, the yield curve was inverted, mortgage rates were above 7%, and inflation has fallen below its long-term average. Those factors were all considered when Powell announced his decision on Wednesday.
Interesting Articles
Market Update: September 9 - 13, 2024

Weekly Summary
The Federal Reserve is expected to proceed with its first rate decrease of this cycle on Wednesday after headline inflation dropped to 2.5% in August. The anticipated move and positive economic data caused the S&P 500 to rally by 4% last week while the 2-10 interest rate spread normalized for the first time in over two years.
Economic Data
The highlight of the busy week of economic data was the August inflation report, which showed that headline CPI has now decreased to 2.5%. Although shelter costs remain high, with a year-over-year growth rate of 5.2%, the decline in shelter prices from last year's peaks helped bring down headline inflation. However, core inflation—which is more heavily influenced by shelter—remains elevated at 3.2%.
Equities
After decreasing by 3.5% two weeks ago, stocks reversed course and rallied 4% last week as inflation data confirmed that markets are entering a new regime, with the FOMC expected to cut rates on Wednesday. Small-caps resumed their recent outperformance last week, benefiting from lower interest rates. Following years of underperformance, that trend is now reversing. The S&P 600 Small-Cap Index has now outperformed the S&P 500 on a three-month basis, returning 9.2% compared to a 3.9% return for the S&P.
Fixed Income
The yield curve remained normalized last week, following the end of its historically long inversion the previous week. Attention is now focused on the Federal Reserve's Wednesday meeting, where it is expected to cut interest rates by at least 25 basis points. The Fed is responding to inflation, which has fallen to 2.5%, and unemployment, which has risen to 4.2%. These factors make a strong case for rate cuts, with the only question being the magnitude. Markets are eagerly awaiting the Fed's decision on whether to cut by 25 or 50 basis points, as well as any guidance on the path for interest rates throughout 2024.
Commodities
Oil prices remained below $70 per barrel last week, as the market continued to struggle with oversupply following OPEC+'s announcement that it will soon increase production. Paired with ongoing weakness in China, this has led to an oversupplied market, with prices falling more than 20% over the past year.
Interesting Articles
Market Update: August 26 - 30, 2024

Weekly Summary
After a strong start to the week, Nvidia reported earnings on Friday. While the company did beat expectations, investors were looking for larger revenue numbers and the stock has since dropped 15% from it’s all time high two weeks ago. The disappointing earnings call pressured the entire market and the S&P 500 ended the week up just 0.28%.
Economic Data
The Federal Reserve’s preferred measure of inflation, Personal Consumption Expenditures, was released on Friday and was slightly lower than expected. Economists expected PCE for July to grow by 2.6%, but instead it grew slightly less at 2.5%. The continued progress on inflation is welcome sign for Jerome Powell and the FOMC as they gear up for their September meeting in two weeks. Markets are currently expecting them to make a small 25bp cut at the September meeting after Powell recently confirmed they will be cutting rates in two weeks.
Interesting Charts

This bar chart shows the current probabilities of a Federal Reserve rate decrease in two weeks. Currently, the Federal Funds futures market is putting a 61% chance of a 25bp rate cut on September 18, while placing a 39% chance on a more aggressive 50bp cut.

Since Powell’s August 23 speech at Jackson Hole, small-cap stocks such as the Russell 2000 Index have finally been outperforming the largest companies in the S&P 500. High interest rates have had an outsized negative effect on small-caps versus large-caps, so small-caps will welcome a return to a lower interest rate environment.

Our last chart this week shows why the Federal Reserve is going to be decreasing interest rates in September. You can see that the unemployment rate has been slowing increasing, while inflation has been steadily decreasing for the past two years. The Federal Reserve has a dual mandate, which is to achieve full employment and maintain price stability. Prices appear to be stable and the unemployment rate has been increasing, therefore the Fed believes it should decrease interest rates in an attempt to slow the increase in the unemployment rate.
Interesting Articles
Market Update: August 19 - 23, 2024

Weekly Summary
The Federal Reserve’s annual Jackson Hole summit took center stage last week, as Jerome Powell signaled that the FOMC may begin cutting rates in September. The news catapulted stocks higher, drove interest rates lower, and weakened the dollar immediately after the announcement.
Jackson Hole Summary
The Federal Reserve hosts an academic conference in Jackson Hole, WY, each August where the bank discusses new economic research as well as deliver an address on the state of the economy. The attention was heightened this year due to the anticipated September rate cut, and the Fed gave the markets exactly what they wanted. Powell confirmed a September rate cut, while keeping all options open for the size and pace of future cuts to remain dependent on economic data.
Powell was very direct, saying, “The time has come for policy to adjust. The direction of travel is clear, and the timing and pace of rate cuts will depend on incoming data, the evolving outlook, and the balance of risks.”
The recent jobs data saw the unemployment rate rise to 4.3%, which is a considerable increase from lows of 3.7% in February. Historically, increases in the unemployment rate of this magnitude have only occurred during recessions. We currently have access to real time economic data that shows the economy remains very strong, with Q3 GDP growth expected to reach 2%. So while it appears that the economy is not currently in a recession, the increase to the unemployment rate is significant enough to initiate a new interest rate regime.
Markets cheered and increased by over one percent on Friday alone, bringing the weekly total gain to 1.41% and pushing YTD gains to nearly 20%. Bond markets also rallied as the 2-year dipped below 4%, which is more than a full percent below 2023 levels.
The decrease in rates following the meeting also caused the dollar to weaken, and the dollar now sits at YTD lows against most major currencies.
Currently markets believe the Fed will cut a total of 1% in 2024, with the September cut being just 25 basis points before accelerating through the end of the year. The Fed has maintained that they will be data dependent, which thrusts new risks into the equation. If there were to be a reversal in the weakness in the unemployment rate, or if there was an upside surprise on the inflation rate, the Federal Reserve would likely be forced to hold off on a rate cut in September.
This leaves the markets in a holding pattern until the September 18 meeting. Before that meeting we will get both August employment and inflation data, which will be critical in determining the future path of cuts for the Fed.
Interesting Articles
Market Update: August 5 - 9, 2024

Weekly Summary
After a volatile start, the S&P 500 recovered sharply, ending the week flat despite rising interest rates as selloff fears subsided. There were no major economic releases, but attention focused on the unwinding of the 'yen-carry trade,' which disrupted stock and bond markets and led to the first significant volatility of 2024.
‘Yen-Carry Trade’ and the Market Sell-Off
Following the Federal Reserve’s July meeting two weeks ago, markets grew increasingly concerned that the Fed was behind the curve and should have cut interest rates at their June meeting. These fears were heightened by a surprisingly weak jobs report just two days after the Fed's meeting. The disappointing jobs data, combined with the Fed's rate decision, sparked fears that the economy was weaker than anticipated, leading to sharp losses in the dollar and a significant drop in interest rates.
The sharp decline in the dollar was joined by a stronger yen, which caused a very leveraged trade to unwind. Essentially, investors had been borrowing money in Japan due to incredibly low interest rates, and then investing that money into various US securities such as Treasury bonds and stocks. The trade provided low cost leverage since Japan’s interest rates are still hovering around zero, and a continued strengthening in the dollar provided an attractive backdrop for the trade.
The combination of the Fed and economic data that sparked interest rates to decline, caused the dollar to weaken significantly as well as a sell-off in the stock market. This sell-off was then exacerbated as margin calls started rolling in for the carry trade. Since the yen was now stronger, not weaker, traders were forced to close out their dollar positions to provide margin for the yen loans, which then forced selling of assets. The carry-trade selling combined with the poor economic news was a perfect storm for market volatility.
The NASDAQ officially entered into correction territory on Wednesday as it was down 11.5% from its recent highs, while the S&P 500 experienced a 7% decline from the highs. However, markets were able to quickly bounce back after the carry trade unwound, returning over 2% on Thursday alone to finish the week flat. Interest rates are now back to pre-carry trade levels, while the curve remains inverted at the two and ten year marks.
Interesting Articles
Market Update: July 29 - August 2, 2024

Weekly Summary
Global asset markets are in the midst of a sharp sell-off following weak US economic data on Thursday and Friday. Japan’s Nikkei plunged over 12% on Monday morning, while NASDAQ futures show the index is set to open 5% lower on the day.
Economic Data
The highlight of last week was the July employment report, which was much weaker than expected. Headline payrolls grew by just 114,000, the second weakest month in over two years, while the unemployment rate increased to its highest level in nearly three years at 4.3%. Economists expected payrolls to grow by 185,000, so this report was substantially weaker than expectations. Interest rates and stock prices immediately dropped following the report, as the weak data fueled worries that the Federal Reserve has already waited too long to cut interest rates.
Equities
The S&P 500 capped off one of its worst weeks of the year, falling over 2% to push the Q3 return into negative territory. On Wednesday, the Federal Reserve all but confirmed that it will be decreasing rates at their next meeting in September, which caused the S&P 500 to increase by nearly 2% on the day. However, the weak economic data on Thursday and Friday sparked new fears as markets now worry that the Fed has waited too long to decrease interest rates. Global stock markets fell on Thursday and Friday, while Japanese stocks dropped by nearly 10% on Monday morning, August 5.
Fixed Income
The yield curve experienced extreme moves following the weak jobs report on Friday, and both the two- and ten-year Treasury rates are now below 4%. The 2-year Treasury rate is down to 3.74%, just two basis points above the 10-year Treasury. If the curve does un-invert around the 2/10 spread, it will mark the first normal yield curve in over two years. The sharp decline in rates pushed bond returns higher, with the US Aggregate Bond Index finishing the week 2.4% higher.
Commodities
Oil declined last week as global growth fears accelerated, and is now nearing 2024 lows as it closes in on $70 a barrel. Oil has now fallen 15% in the past four weeks, causing gas prices to hit new year-to-date lows. Gold reached a new all-time high on the global growth fears.
Interesting Articles
Market Update: July 22 - 26, 2024

Weekly Summary
Last week was a continuation of recent momentum in the stock market, with large-cap stocks selling off while small-cap stocks rallied. There were two key pieces of economic data released, inflation and GDP, and both were stronger than expected. Interest rates continue to fall, and the 2-year is at its lowest level since January.
Economic Data
Second quarter GDP was released on Thursday, and it was much better than expected. The economy grew by an inflation-adjusted 2.8%, exceeding the 2% growth rate anticipated by economists. The release was coupled with a shockingly weak durable goods release, and the immediate market reaction after both was a sharp decline in interest rates and a continued rally in small-caps. The Federal Reserve’s preferred inflation measure, Personal Consumption Expenditures, was released on Friday which was also positive. Headline PCE dropped to 2.5%, and the core PCE index sits at 2.6%.
Equities
The S&P 500 again finished in negative territory as second quarter earnings season is now in full swing. Large-cap tech earnings have been surprisingly disappointing, and there were large sell-offs in mega-caps last week such as Google and Tesla. Both reported disappointing earnings last week, and their stocks fell by 6% and 8% on the week respectively. The weak tech earnings coupled with the decline in interest rates put gasoline on the fire of the recent market capitalization rotation in the stock market. The NASDAQ declined by 2.5% on the week, while the Russell 2000 Small-Cap Index increased by 3.4%.
Fixed Income
Rates across the curve continue to decline as economic data has cooled and markets look towards a Federal Reserve rate cut in September. The 2-year Treasury is nearing its recent January 2024 lows and is now firmly un-inverted with the 30-year interest rate. It has now fallen over 60 basis points since the 5% level seen in late April. Futures markets continue to predict a rate cut at the September meeting, and barring a black swan event in the economy, it appears that the September rate cut is essentially guaranteed.
Commodities
Oil posted its largest weekly decline since May as prices dipped back below $80 a barrel. Global growth worries accelerated as China unexpectedly cut interest rates in an attempt to stimulate its economy. Slow Chinese economic growth has helped keep oil prices low, as China is the largest oil importer in the world. China has struggled to restart economic growth post-COVID after the government essentially shut the country down for three years.
Interesting Articles
Market Update: July 15 - 19, 2024

Weekly Summary
Large-cap stocks sold off last week following a weak inflation report from the prior week. The weak inflation report caused interest rates to decline dramatically, and that decline caused large dispersion between small and large cap stocks. The CrowdStrike and Microsoft IT outage on Friday further widened this gap, as Microsoft, the world’s largest company, fell by nearly 4% during the week.
Economic Data
It was a light week for economic data as retail sales were the only major indicator released. Retail sales during June were flat, but the May growth rate was revised higher. All attention has shifted to Q2 GDP and PCE, which will be released on Thursday and Friday, respectively. A weak PCE reading would add further confidence that the Federal Reserve will decrease interest rates at its September meeting.
Equities
The S&P 500 finished with one of its worst weeks of the year, declining by 1.96% as large-caps fell following the continued interest rate decline. Small-caps, which prior to last week were negative year-to-date, increased by 1% on the week. Since the July 11 CPI release, the Russell 2000 has increased by 6.7% while the S&P 500 has fallen by 2.2%. The primary driver for this divergence has been interest rates. Higher interest rates over the past three years have disproportionately hurt small-caps compared to large-caps, which is evident in their 1.7% three-year total return compared to 32.1% for the S&P 500. Therefore, the sharp decline in interest rates since June 11 has provided significant tailwind for the Russell 2000 as it attempts to close the year-to-date gap with the S&P 500.
Fixed Income
Interest rates continued their recent declines last week, with the 2-year and the 30-year briefly returning to normalization, and the 2-year Treasury is now down to 4.52%. This is the lowest 2-year rate since March, when markets still expected multiple interest rate decreases during 2024. The Federal Reserve does meet next week, but it is not expected to decrease rates until its September meeting.
Commodities
While energy prices have been relatively stable for much of the year, there have been interesting movements in other commodities. Copper, one of the most widely used metals in the world, is expected to face a massive supply disruption over the next ten years due to increased demand. This expectation has pushed copper prices higher by more than 10% in 2024.
Interesting Articles
Market Update: July 8 - 12, 2024

Weekly Summary
The Federal Reserve finally received the good news it was hoping for, as headline CPI contracted during the month, marking the lowest reading since April 2020. The news catapulted stock and bond markets higher, with small-cap stocks leading the way with a 4.8% total return on Thursday and Friday alone. The 2-year and 30-year are now un-inverted, as short-term rates fell on the expectation that the Fed will cut rates for the first time in September 2024.
Economic Data
The June CPI release on Thursday was the highlight of a busy economic week. CPI fell by 0.1% month-over-month, its first decrease in over four years. Markets have been patiently waiting for the shelter component of CPI, the largest individual input, to slow. Shelter has been stubbornly high and is commonly believed to be on a severe input lag within the data, but June’s data marked the 15th straight month that shelter CPI has slowed.
Equities
US equities rallied on Thursday and Friday after the CPI release, with small-caps finally leading the charge. Last week saw several long-term market trends reverse with the lower inflation release, as small-caps, bank stocks, and value stocks all led the way. Small-caps have been plagued by negative year-to-date returns, as higher rates have disproportionately hurt smaller companies compared to large, mega-cap companies. The slow CPI caused rates to have sharp declines towards the end of the week, and this pushed small-caps significantly higher and into positive territory on the year.
Fixed Income
Barring an unexpected jump in inflation within the next month, the Federal Reserve is now expected to decrease interest rates at its September meeting, marking the first rate decrease of this cycle. Markets have been waiting for a rate cut for the entirety of 2024, so this expectation was extremely welcomed by bond markets. The sharp decrease in short-term interest rates has caused the 2-year and 30-year interest rates to resume a normal relationship for the time being. The yield-curve has now been inverted for the longest period in recorded history, so any resumption of a normalized environment is welcomed.
Commodities
Oil continued its extremely tight range last week and remains just above $80 a barrel despite increased geopolitical tensions. US domestic oil production continued to increase last week, reaching a new all-time high and further cementing our dominance in the oil market.
Interesting Articles
Market Updates: July 1 - 5, 2024

Weekly Summary
The June employment data release on Friday was the highlight of the short week, and both stock and bond markets welcomed the slight increase in the unemployment rate. It seems counter-intuitive for asset prices to increase on weak economic data, but the focus remains on the Federal Reserve and the future path of interest rates.
Economic Data
It was a busy week for economic data releases, starting with the ISM Manufacturing PMI on Monday and ending with the June jobs report on Friday. All major economic data missed economists’ expectations, and the unemployment rate has now increased for four straight months and sits at 4.1%, which is 0.7% higher from its 3.4% low last year. The economy did add slightly more jobs than expected, with 206,000 payrolls added, but the unemployment rate increase overshadowed that information.
Equities
The S&P 500 had a great week and is now up 17.4% in 2024. The “bad news is good news” theme reemerged last week, with markets increasing with each release of poor economic data. Second quarter earnings calls kick off later this week, and those calls are always incredibly important for interpretating current economic data and the path of the economy going forward.
Fixed Income
Fixed income markets remain highly sensitive to the expected future path of interest rates, and the yield curve has now been inverted for the longest period in history. After the negative data last week, chances of a rate decrease in September increased to 70%. If the Federal Reserve were to lower interest rates at this meeting, it would finally be the beginning of a rate decrease cycle that has the potential to uninvert the yield curve for the first time in over a year.
Commodities
Oil prices increased slightly but are still within a relatively stable range despite continued unrest in the Middle East. Oil inventories, which can have a large impact on prices, have been slowly decreasing during the summer months due to increased demand. The United States remains the largest oil producer in the world, but the 2024 summer travel season has been the busiest in history and that increased demand has helped keep prices above $80 for the last few weeks.
Interesting Articles
Market Update: June 24 - 28, 2024

Weekly Summary
The market remained relatively flat this week, with the S&P 500 closing the second quarter up 4.4%, bringing the 2024 return to 15.2%. The week's highlight was the PCE Price Index, the Federal Reserve's preferred inflation measure, which met economist expectations. Initially, this news spurred a Friday rally, though markets cooled by session's end, resulting in a flat close for the week. Note that this week includes a shortened trading schedule, with markets closing at 1pm on July 3rd and remaining closed all day on July 4th. The upcoming release of June employment data on July 5th will be pivotal.
Economic Data
The Personal Consumption Expenditures (PCE) Index, the Fed's favored inflation gauge, rose 2.6% in May, aligning with economist forecasts. Core inflation also saw a slight dip to 2.6% from April's 2.7%, maintaining a stable range of two to three percent for eight consecutive months. This consistency is expected to bolster the Federal Reserve's plan for its first rate decrease later in the year.
Equities
Equity markets concluded the quarter quietly, with a 0.4% decline on Friday pushing the S&P 500 into negative weekly territory. The most significant market movement followed the PCE report, initially lifting the index nearly one percent before retracting by day's end. Despite persistent inflation and no rate cuts from the Fed, the index has shown strong performance, up 15% in the first half of the year.
Fixed Income
Fixed income markets experienced heightened volatility, with the 10-year Treasury rate rising 15 basis points for the week. Friday's PCE report triggered a 10 basis point increase alone, following a relatively stable week. This year's interest rate fluctuations have been notably high amidst uncertainty surrounding Federal Reserve actions and economic data. The 10-year Treasury rate began the year at 3.87%, peaked at 4.71% in April, and has since moderated.
Commodities
Oil prices remained stable around $80 per barrel last week, showing minimal volatility. Amidst Middle East conflicts impacting global oil production, the U.S. has emerged as the world's largest oil producer, achieving record-high production levels this week. Additionally, recent reports indicate U.S. energy production now surpasses consumption by significant margins, highlighting evolving trends in the energy sector.
Interesting Articles
Market Update: June 10 - 14, 2024

Weekly Summary
This week markets were dominated by the release of two US inflation measures along with a Federal Reserve meeting on Wednesday. Both equity and fixed income markets performed well after the release of these measures was more optimistic than expected. The Federal Reserve meeting was fairly uneventful with officials mostly echoing statements made at the previous meeting at the end of April. Futures markets are now predicting a higher chance of interest rate cuts this year but are still far less optimistic than they were at the start of the year.
Economic Data
The most significant piece of economic data last week was the Consumer Price Index, a measure of US inflation. CPI released on Wednesday at 3.3%, just under the forecast of 3.4%. The core version of this index, which excludes food and energy prices, also released under its forecasted rate at 3.4% rather than 3.5%. The Producer Price Index, a measure of inflation for business expenses rather than the average consumer, released even lower than the 2.5% forecast at 2.2%. The core version of this metric released at 2.3% rather than the forecasted 2.4%. Germany also released consumer inflation data showing a year over year increase in prices of 2.2%.
Equities
Equity markets celebrated the positive inflation data and appeared unconcerned after the Federal Reserve meeting on Wednesday. The Federal Reserve announced they would hold short term interest rates steady at 5.5% as expected. A new “dot plot” released this meeting and implied the Federal Reserve will cut rates one time less this year than they signaled with the previous dot plot release in March. Neither equity nor fixed income markets seemed concerned with this as the move was widely expected. Tech companies performed particularly well with the Nasdaq 100 gaining over 3.5% though the week, in comparison to the 1.64% return of the S&P 500.
Fixed Income
Fixed income markets were fairly volatile last week, though this was unsurprising considering the release of two inflation readings along with a Federal Reserve meeting. Ten year treasury yields fell from roughly 4.47% all the way down to roughly 4.21% throughout the week. Rates are now at the lowest levels they have been since early April. Futures markets priced in an even higher chance of interest rate cuts by the end of the year, with the probability of at least one cut by December at roughly 95%. September projections, which were previously the break point with only a 50% probability of a cut are now predicting an over 62% probability of a cut at the next or following meeting on September 18th.
Commodities
Oil prices corrected up last week to slightly under $80.00 a barrel, snapping a three week decrease that brought prices as low as $73.25. The announcement of a less restricted supply by OPEC+ drove prices down throughout the month, but analysts are now predicting demand will increase through the warm summer months. Gold performed well with an impressive gain of 1.9% throughout the week, but much of these gains were reversed over the weekend. Natural gas prices actually fell last week after several weeks of seasonal prices increases. The ongoing heat wave is expected to cool about a week from now which will likely result in a reduced demand for electricity.
Interesting Articles
Market Update: June 3 - 7, 2024

Weekly Summary
The Bank of Canada and the European Central Bank both announced a decision to reduce interest rates by a quarter of a percent last week. Equities made gains throughout the week, but this trend reversed on Friday after the release of the US jobs report. Unemployment increased slightly in May, but this was overshadowed by significantly higher than expected payroll increases. This led to a sharp rise in interest rates that wiped out nearly all US bond gains made over the past month. Political uncertainty increased worldwide after Mexico, India, and the European Union announced election results that diverged significantly from the results predicted by polling. The price of Oil and Gold fell significantly after announcements made by OPEC+ and China’s central bank.
Economic Data
The Institute for Supply Management released two PMI economic indicators last week. The first, manufacturing PMI, released at 48.7 versus a forecast of 49.6. The services PMI released at 53.8 versus a forecast of 50.8. Any reading above a 50 indicates expansion, meaning the US manufacturing industry has begun to contract while the services industry continues to expand. The Eurozone announced GDP growth of only 0.3%, though this was still stronger than the forecast of -0.1%. Canada announced unemployment of 6.2%, up from 6.1% and significantly higher than US unemployment. The main economic release awaited last week was the US jobs report by the Bureau of Labor Statistics. US unemployment was expected to stay flat at 3.9% but increased slightly to 4.0%. However, payrolls in the US increased by roughly 272,000, significantly higher than the prediction of 158,000.
Equities
Equity markets slowly ticked up last week with the S&P 500 gaining 1.38% Monday through Thursday. However, the sharp increase in payrolls released Friday pushed out expectations of a rate cut by the Federal Reserve, resulting in a total weekly gain of only 1.26% for the index. The tech heavy Nasdaq-100 was less affected by these rate expectations and gained an impressive 2.72% throughout the week. Mid and small cap companies struggled to keep up, as these companies tend to hold much larger amounts of floating rate debt. Mexican equities fell after political uncertainty increased after the leftwing party Morena won a landslide election, giving the party a supermajority in Congress. A similar trend occurred in the Eurozone after several far-right parties gained further power in France, Germany, and Austria. France’s president Emmanual Macron announced a snap parliament election following these results and the country’s Cac 40 stock index fell 1.9% to its lowest level since February.
Fixed Income
Last week two major central banks, the Bank of Canada and the European Central Bank, announced their decisions to reduce interest rates by a quarter of a percent. These decisions were expected due to Canada and European countries suffering from higher unemployment and struggling less with inflation compared to the US. US fixed income markets were significantly more affected by the mixed employment data released on Friday. The large growth in payrolls increased fears that the Federal Reserve may only cut rates by a quarter of a percent by the end of the year, or possibly not at all. On Thursday futures markets were predicting about a 95% chance of at least one rate cut by the Federal Reserve meeting in December, but this dropped down 89%. The probability of a rate cut by September fell from over 70% to only about 50%. The associated increases in interest rates caused a slide in the US bond market, though rates still remain slightly lower than they were a month ago.
Commodities
Oil prices fell rapidly and broke below $75.00 a barrel on Monday after OPEC+ announced an end to the voluntary production cuts that began earlier this year. Prices corrected up slightly throughout the week though they remain at the lowest level since February. Natural gas continued its normal seasonal increase in price after a break a week before due to higher-than-expected US inventory levels. Prices are expected to keep increasing due to warm weather predicted through the rest of the month. Despite this, storage inventories in the lower 48 states are still 25% higher than the five-year average. Gold prices began to fall after trading sideways for the past two months after China announced its central bank had halted its regular gold purchases in May.
Interesting Articles
Market Update: May 27 - 31, 2024

Weekly Summary
The beginning of last week was fairly slow with markets only being open for four days off the back of Memorial Day weekend. Tuesday through Thursday was spent in anticipation of major inflation data for the US and Europe released on Friday. Inflation came in as expected in the US and only slightly higher than expected in the Eurozone, providing investors with another piece of evidence that rate cuts are still on the horizon. Equities trickled down and rates trickled up Tuesday through Thursday, before reversing on Friday on the back off this positive news. Oil prices fell this Monday after OPEC+ announced an end to voluntary production cuts that began earlier this year.
Economic Data
This week was filled with a few minor pieces of economic data until an explosive Friday. On Tuesday the Conference Board Consumer Confidence Index released at 102.0 versus an expected 95.9. Any reading above 100 indicates that consumers are more confident than the benchmark. The following day inflation in Germany released at the expected 2.4%. US quarterly GDP growth released at an annualized 1.3% as expected, though lower than the previous quarter’s rate of 3.4%. On Friday the Personal Expenditures Price Index, a key measure of US inflation, released at 2.7% as expected. The core version of this metric, which excludes volatile food and energy prices and is more closely followed, also released at the expected 2.8%. Finally, core inflation in the eurozone released at 2.9%, slightly higher than the expected 2.8%.
Equities
The S&P 500 slowly ticked down throughout last week, falling about 1.45% Tuesday through Thursday. Markets celebrated on Friday after the positive Core PCE release with the index gaining 0.88% back. The Nasdaq 100 followed essentially the same pattern although gains were less pronounced on Friday after strong performance the week before on the back of a positive earnings call by the chip manufacturer Nvidia. Performance on Friday was especially positive for small and mid-cap companies, which have struggled to keep up with the performance of larger companies this year. Rate cuts are seen as even more beneficial to these smaller companies which carry higher amounts of floating rate debt and have more difficulty holding on to cash and negotiating for favorable fixed rate debt compared to the largest companies in the US.
Fixed Income
A similar pattern occurred in fixed income markets with rates slowly but mildly increasing throughout the week before dropping on Friday and through the weekend. 30 year treasuries fell from about a 4.69% yield down to 4.55%. 2-year yields fell from about 4.92% to about 4.82%. Overall fixed income markets seem to be moving into a similar position seen earlier this year when rate cuts were viewed as imminent. Futures markets are now predicting over a 91% chance of at least one rate cut by the Federal Reserve’s final meeting of the year in December, up from about 82% the week before. Futures markets were previously predicting about a 50/50 chance of a rate cut by the meeting in September but have now moved to a 65% probability of a cut by the same meeting.
Commodities
Oil prices began the week slightly under $80.00 a barrel but fell to slightly under $77.00 on Friday. Prices fell even further and broke below $75.00 a barrel on Monday after OPEC+ announced they would begin phasing out the voluntary production cuts that began earlier this year. With this significant increase in oil available in the market analysts expect that prices will remain low through the rest of the year and into 2025. Natural gas prices were uneventful and continue to increase at a slow seasonal rate. Gold fell about 0.85% through the week but reversed back to the same price levels as of this Monday.
Interesting Articles
Market Update: May 20 - 24, 2024

Weekly Summary
Equity markets overall were essentially flat last week, though tech stocks got a nice boost after the chip manufacturer NVIDIA announced higher than expected earnings. Several pieces of economic data released showing that the average American is more confident in the economy than previously expected. Fixed income rates rose, but only to about the same levels seen earlier this month. Oil prices remained flat while the price of natural gas continued its upward trend. A major change in the way market trades are settled came into effect this Tuesday. The Core Personal Expenditures Price Index measure of inflation is set to release this Friday and will likely have significant effects on the Federal Reserve’s outlook on rates for the rest of the year.
Economic Data
There were a fair number of economic releases last week heading into the three-day weekend. On Tuesday Canada announced an inflation rate of 2.7%, matching projections and falling from 2.9% in March. The core version of this metric, which excludes food and energy prices, dropped significantly to only 1.6% compared to 2.0% in March. In the UK we saw a different trend with inflation coming in slightly higher than expected. However, we still saw the headline drop from 4.2% to 3.9% and core drop from 3.2% to 2.3%. The Michigan Consumer Sentiment survey released at 69.1, higher than the expected 67.5. Initial unemployment claims released at 215k, lower than the 220k prediction. This Tuesday consumer confidence released at 102.0, significantly higher than the forecast of 95.9, with any reading above 100.0 indicating confidence is increasing. These pieces of data together imply that the average American is becoming more optimistic about the state of the economy as fear of a recession continues to fade.
Equities
Equity markets moved little last week with the S&P 500 ending flat from the Friday before. One notable and highly anticipated event was the earnings call of chip manufacturing company NVIDIA. NVIDIA’s market cap has exploded over the past year as the company produces GPUs and CPUs needed to run artificial intelligence programs. Revenue was 5.90% higher than predicted by economists while net income was 9.68% higher. NVIDIA is now the third largest publicly traded company in the world by market cap, surpassing even Alphabet, formerly known as Google. This helped the tech heavy Nasdaq-100 rise 0.94% over the week despite the S&P-500 remaining flat. US markets moved from what’s referred to as T+2 to T+1 this Tuesday. This means that market trades will need to be settled in one day rather than two for the first time since The Great Depression. This will likely cause increased volatility as professional investors are now required to come up with liquid cash more quickly than before.
Fixed Income
Rates increased last week though only to a minor degree, relatively similar to the levels seen earlier this month. Futures markets projections of the Federal Funds rate decreased from an 88.6% projection of a rate cut by the end of a year to an 84.4% projection. The major topic of discussion this week will center around the release of the Federal Reserve’s preferred inflation metric, the Core Personal Expenditures Price Index. This metric is expected to release at 2.8%, the same rate as the prior month. The release on Friday will be extremely important heading into the next Federal reserve meeting on June 12th. The Federal Reserve has repeatedly emphasized that rate cuts will not come until data shows inflation is heading in the right direction, so a creep up to 2.9% would be highly significant. If the metric matches projections, it will be the fifth straight month inflation has released below 3.0%.
Commodities
Oil prices also moved little last week and continue to trade under $80.00 a barrel. Prices decreased below this level earlier in the month and have only broken back above it for a very short period on the 19th. The next significant move may come after the upcoming OPEC+ meeting on the 2nd of June. The oil cartel is expected to maintain its current output cuts of 2.2 million barrels a day, so an increase would likely immediately result in a significant price increase in the short term. Natural gas prices rose yet again after it was announced that US underground stockpiles rose less than analyst predictions. However, storage levels remain about 17.4% higher than the 2023 level and 28.8% higher than the five-year average. Gold prices initially traded up before falling a total of 3.8% Wednesday and Thursday. Despite this gold has appreciated an impressive 14.5% since the beginning of this year.
Interesting Articles
Market Update: May 13 - 17, 2024

Weekly Summary
Both equity and fixed income markets continued gains last week on the back of positive inflation readings, though one of these metrics could be considered mixed. This caused increased speculation about the heaviest topic of discussion this year: when the Federal Reserve will finally decide to begin decreasing interest rates. Natural gas and gold continued the upward trend in prices seen over the last two months while oil prices were essentially flat.
Economic Data
The most significant pieces of economic data released last week were two measures of US inflation. The Producer Price Index, which measures inflation as it relates to company’s expenses, released at 2.2% as forecasted. The month over month data was higher than the 0.3% forecast at 0.5%, but March’s release was revised down to -0.1%, allowing the index to match its forecast. The core version of this metric also released at the forecasted 2.4% and had its March release revised down. The following day the more anticipated Consumer Price Index released at the forecasted 3.4%, down from the previous month’s 3.5% release. The core version also released at the forecasted 3.6% and decreased from 3.8% in March.
Equities
Equity markets were flat on Monday in anticipation of the first inflation metric release. Markets initially appeared skeptical after PPI missed its month over month forecast but turned around in the second half of the trading day, with the S&P 500 ending the day up 0.11%. CPI matching projections the next day confirmed that inflation is currently heading in the right direction and the S&P 500 gained slightly over 0.58%. The more tech heavy and volatile NASDAQ 100 gained about 0.89%. Both Indexes have now reached new all time highs but made only minimal gains on Thursday and Friday. Investors celebrated on Friday after the Dow Jones Industrial Average closed above the 40,000 mark for the first time. While this is ultimately only an arbitrary number it’s still a reminder that markets are again headed in a positive direction after the short term bearish trend last month.
Fixed Income
Treasury markets also reacted positively to these inflation metrics, though the trend was less pronounced. The ten year Treasury interest rate dropped four basis points, or 0.04% throughout the week and the two year dropped three. Somewhat surprisingly projections for rate cuts in the futures market were largely unchanged. These markets are now pricing in an 89% chance of at least one rate cut by the end of the year versus about 88% the week before. A growing topic of discussion is less about how much rates will drop, but when the Federal Reserve will begin taking action. The first rate cut will likely cause an even further rally in equity and fixed income markets but the Federal Reserve is mandated to operate without taking politics into account. This means cutting rates before November could cause accusations of the Fed of favoring President Joe Biden. Despite this November’s Fed meeting will take place only two days after Super Tuesday and the December meeting will take place before the election winner is sworn in on January 20th, giving them a potential window to cut rates while avoiding these potential accusations.
Commodities
Oil prices increased slightly last week but ultimately were essentially unchanged. Unlike stocks which only “officially” trade during business hours, commodity futures trade 24/7. This meant the death of Ebrahim Raisi, Iran’s former president, caused a notable spike in prices after it was announced on Sunday. However, this spike quickly reversed which is another sign that oil markets are only mildly concerned with continued unrest in the region. Natural gas continued an upward trend though prices remain far below averages seen in 2021 through 2023. US stockpiles in underground storage are significantly above the five-year maximum which has helped ease inflation through relatively low energy prices. Gold continues to trade at abnormally high prices and gained 3.84% last week alone.
Interesting Articles
Market Update: May 6 - 10, 2024

Weekly Summary
Equities markets continued their gains last week after a strong earnings season comes to an end. Fixed income markets were essentially unchanged while oil prices continued to fall. Two key inflation metrics release this week and have the potential to have a large impact on fixed income markets and expectations of short-term rates set by the Federal Reserve. Several major oil companies are currently facing class action lawsuits with the FTC alleging further complaints of potential price collusion in the industry.
Economic Data
Last week the Reserve Bank of Australia and the Bank of England met with both central banks deciding to hold rates steady as expected. The Michigan consumer sentiment index, which tracks citizens current and future views of the economy released at 67.4. This was much lower than the expected 76.0 and indicates that the average consumer’s outlook is becoming more negative. This week a large focus will be placed on two inflation metrics. The Producer Price Index, which focuses on prices related to companies will release Tuesday and is expected to be roughly 2.4% from this month last year. The following day the Consumer Price Index, a measure of inflation focusing on the average American is expected to release higher at 3.4%. The core versions of both these metrics, which strips out food and energy prices are expected to be slightly higher. While PPI and CPI follow a similar trend PPI tends to increase or decrease before CPI as price changes take a while to be passed onto consumers.
Equities
The trend of strong earnings releases continued last week giving a nice boost to equities. About 92% of the companies in the S&P 500 have reported earnings with a large number meeting or exceeding profit targets set by market analysts. The index is now only about 0.5% under the all-time high the index achieved in March of this year. Performance since the start of this month has been strong with the S&P 500 gaining 4.11% and the tech heavy NASDAQ 100 gaining 5.08%. We could see this trend reverse if inflation data comes in higher than expected but this would likely have a larger impact on the fixed income market.
Fixed Income
Fixed income markets were largely unchanged last week following a significant drop in rates the week before. Two-year interest rates fluctuated between 4.82% and 4.85% and ten-year interest rates stayed flat at about 4.48%. Expectations that the Federal Reserve will cut rates were also largely unchanged with futures markets predicting about an 85% to 90% chance of at least one rate decrease by the end of this year. These predictions can move very quickly, and likely will on Wednesday depending on if CPI releases above or below target.
Commodities
Oil prices continued to decrease last week after hitting a short-term peak at the beginning of April. Several major shale oil companies are currently involved in class action lawsuits and Scott Sheffield, the former boss of Pioneer Natural Resources, was accused by the FTC of attempting to collude with OPEC to increase oil prices. It's currently unclear how these lawsuits will affect prices going forward. Gold prices increased about 1.63% but reversed over the weekend, leading to a total weekly gain of only 0.49%. This came off the back of a major rally earlier this year, where gold prices increased 19.78% from mid-February to Mid-April. Natural gas prices continue to increase, which is common as we approach the higher temperatures of the summer. About 30% of power plants in the US use natural gas to generate electricity, so heavier use of air conditioners can have a large impact on price.
Interesting Articles
Market Update: April 29 - May 3, 2024

Weekly Summary
Markets spent most of last week waiting for employment data releasing Friday, hoping the unemployment rate might shed more information on the Federal Reserve’s next move. The first quarter earnings season is coming to a close with most companies announcing higher than expected increases in revenue and net income. Treasury yields reversed course after a period of increases for most of April. Oil prices fell, implying that fears of disruption in the middle east are less likely. Natural gas followed the reverse trend and increased to a fourteen-week high.
Economic Data
There were several pieces of worldwide inflation date released last week. Most notably, Germany reported an inflation rate of 2.2%. This was the same rate as March but slightly more optimistic than the 2.3% forecast. The Eurozone overall announced year over year inflation of 2.4% as expected and the same rate as March. The most significant piece of economic data last week came on Friday. The United States gained 175,000 jobs in April, significantly lower than the prediction of 243,000 and March’s increase of 315,000. The unemployment rate for April came in at 3.9%, up 0.1% from the previous month and slightly higher than the same forecasted rate.
Equities
The S&P 500 fell on Tuesday and Wednesday but rebounded on Thursday and Friday for a total gain of 0.6% for the week on the back of positive sentiment now that nearly all companies in the index have reported first quarter earnings. Earnings reports were extremely strong overall last quarter, increasing 5.0% from the first quarter of last year. The unemployment rate releasing slightly higher than expected actually boosted the equity market because of an expectation that the Federal Reserve may more seriously consider decreasing interest rates if unemployment crosses above 4.0%.
Fixed Income
Treasury rates fell last week on the back of slightly higher than expected unemployment, breaking a four week streak of increases that brought ten-year yields to the highest levels since last November. Perhaps most notably the ten-year rate fell below 4.5% after increasing to over 4.7% the week before. Unemployment data also increased optimism that there may still be rate cuts coming this year. Futures markets are now predicting a 67% chance of a rate cut by September and only a 10% chance that rates will end the year at current levels.
Commodities
Oil prices fell over the weekend and continued this trend continued throughout the week. As of this Monday Western Texas Intermediate is trading at a price of slightly under $79.00 a barrel. This is the lowest price oil has traded at since early March. Gold prices seemingly confirmed that the rally seen earlier this year is over for now, falling 0.45% throughout the week. Despite this gold has still appreciated 12.3% in price since the beginning of this year. The period of low natural gas prices may now be over as well, increasing to over $2.00 for the first time since January.
Interesting Articles
Market Update: April 22 - 26, 2024

Weekly Summary
Markets were calm last week across the board despite higher than expected inflation data releasing on Friday. Equity markets rallied on the back of strong earnings calls by several major companies. Interest rates increased only slightly, with investors now appearing to be less concerned about lingering and higher than average inflation. The Federal Reserve is set to meet this Wednesday, but this meeting is expected to be largely uneventful with the Fed maintaining its previous position. That rates will eventually come down, but only when unemployment or inflation data signal these rate cuts are becoming necessary.
Economic Data
The most anticipated piece of Economic data of the week released on Friday. The Personal Consumption Expenditures Price Index measure of inflation released at 2.7%, slightly higher than the expected 2.6%. The core version of this metric, which excludes food and energy prices and is followed more closely by the Federal Reserve, released slightly higher at 2.8% compared to a forecast of 2.6%. The University of Michigan’s consumer sentiment survey released at 77.2, lower than the expected 77.8 and down from 79.4 in March. One important thing to keep in mind though is that consumer confidence often drops as election seasons approach regardless of the current state of the economy.
Equities
Equity markets performed well last week after several major banks and tech companies announced better than expected earnings calls. The S&P-500 gained 3.01% from the previous Friday’s closing price and higher than expected inflation did not seem to be a major concern to markets, with the index increasing 0.95% on Friday alone despite the pessimistic PCE release. This seems to be part of a continuing shift in equity markets which previously displayed extreme fear of high interest rates. Now that interest rates are not expected to increase investors appear to be placing a higher emphasis on the strong quarterly performance of companies that have already weathered the worst of the storm.
Fixed Income
Fixed income markets were also far less volatile than in previous weeks containing inflation releases. Interest rates for treasuries one year or shorter inched higher but the rest of the yield curve was largely unchanged. Futures markets lowered expectations of rate cuts by the end of the year but moved far less than they did following the CPI inflation release earlier this month. This implies that higher for longer interest rates have already been “priced in” by the market to some degree. Futures markets are still betting on at least one rate cut by September but are but are also projecting a 25% chance of no rate cuts through the rest of the year.
Commodities
Oil prices were largely unchanged last week with prices advancing close to $84.00 a barrel but falling back to the previous Monday’s levels over the weekend. The extreme rally in gold appears to be over in the short term with prices of the precious metal increasing only 0.28% through the week, compared to an increase of over 8.6% in the month of March. Natural gas prices increased but remain significantly lower than seasonal averages. U.S. natural-gas inventories in storage are currently more than 30% above their five-year seasonal average.
Interesting Articles
Market Update: April 15 - 19, 2024

Weekly Summary
Several countries/regions reported inflation data this week, including the UK, Eurozone, and Japan. Equity markets continued to fall in a repeat of the prior week though yearly returns still remain significantly above average. Fixed income markets followed the same trend with medium and long term rates increasing. Oil prices fell and remain relatively low despite Israel’s decision to conduct a retaliatory strike against Iran. The Core Personal Consumption Expenditure measure of inflation is set to release before market open this Friday and is likely to have a significant effect on equity and fixed income markets.
Economic Data
On Monday it was announced that US retail sales increased by 0.7% in the month of March, more than double the forecasted 0.3% but down from February’s increase of 0.9%. China announced its GDP grew at an annualized rate of 5.3% in the first quarter of 2024, slightly higher than the prediction of 5.0%. Like most western economies the UK continues to struggle with inflation with an annualized rate of 3.2% releasing for March and an even higher core inflation rate of 4.2%. The Eurozone is also still struggling with inflation but to a much smaller degree, matching the projected March rate of 2.9%. Finally, Japan reported inflation data matching their projected rate of 2.7%. Core PCE, the preferred inflation gauge of the Federal Reserve, is set to release this Friday and is currently forecasted at 2.7%.
Equities
Equity markets continued to fall this week continuing the cautious trend that’s been seen since the end of the first quarter. The S&P fell 3.07% in total from the closing price of the previous Friday. However, with such a strong start to the year it’s important to look at things from a larger perspective. Despite recent losses the S&P 500 has gained roughly 4.67% since the start of the year after already strong performance capping off 2023. Short periods of corrections after extremely strong periods of gains are common and often considered a sign of a healthy market. Skepticism is necessary to keep expectations in line and avoid major crashes that result from investors caught off-guard after being overly optimistic. This week is expected to be volatile in equity markets with several major tech companies including Microsoft, Alphabet, Meta, and Tesla set to report first quarter earnings.
Fixed Income
US fixed income markets continue to move almost solely as a result of inflation expectations that will guide the Federal Reserve’s policy decisions through the rest of the year. Futures markets still predict either one or two rate cuts by the Fed’s final meeting of the year in December. Higher than expected CPI data released earlier this month squashed beliefs that the Fed’s battle with inflation was nearly over and a near universal expectation that a “soft landing” could be easily achieved. Medium and long term interest rates increased about 0.1% last weekend, following a similar trend of the week before. Despite this, rates are far from the peaks achieved last year when ten year treasury yields increased to over 5.0%, a rate that would have been considered nearly unthinkable several years ago.
Commodities
Crude oil prices provided some relief last week and fell to roughly $83.00 a barrel after peaking at slightly over $87.00 earlier this month as tensions in the Middle East escalated. Commodity traders seemed only mildly concerned after Israel’s retaliatory strike against Iran. Likely because other OPEC+ producers, like Saudi Arabia, have signaled a desire to avoid being drawn into the conflict. Gold continued its rally and increased 1.91% in price throughout the week, though all these gains were erased over the following weekend. Natural gas prices remain relatively low and stable and there are currently few signs of a potential disruption in the market.
Interesting Articles
Market Update: April 8 - 12, 2024

Weekly Summary
Markets entered this week with anticipation for the release two key inflation metrics calculated by the Bureau of Labor Statistics, the Consumer Price Index and the Producer Price Index. Higher than expected CPI reduced optimism for interest rate cuts this year, but this fear was moderated somewhat by a lower than expected PPI release the following day. Oil prices were volatile but ended the week down in price overall. Gold made some modest gains, but prices are now increasing at a far lower rate than in the first quarter.
Economic Data
The first half of last week was spent waiting for the release of the Consumer Price Index measure of inflation for March. On Wednesday headline CPI released at 3.5% year-over-year, slightly higher than the forecast of 3.4% and up from February’s rate of 3.2%. Core CPI, which removes food and energy prices, was also slightly higher than expected at 3.8% versus the forecast of 3.7%. Unlike headline CPI however, core CPI did not increase from February’s reported rate. The Producer Price Index, the measure of inflation related to businesses rather than individuals, released the following day at 2.1% versus a forecast of 2.2%. Core PPI was just above the 2.3% forecast at 2.4%. Finally, the Consumer Sentiment Index reported by the University of Michigan released at 77.9, under the forecast of 79 and down from the prior month’s value of 79.4.
Equities
Equity markets struggled to perform last week following the CPI release and mild losses of the week before. The S&P 500 fell 1.00% on Wednesday after CPI was reported higher than expected, decreasing expectations for the number of rate cuts by the end of the year. However, a low PPI release reduced some fear and resulted in a 0.75% gain back the following day. PPI is often viewed as a leading indicator for where inflation is heading in the medium term as low PPI means many businesses are able maintain current profit margins without large price increases that filter down to consumers. The bull run in the equity market appears to be slowing as companies report first quarter earnings and investors are forced to reflect on the extremely strong gains already made this year.
Fixed Income
Interest rates increased yet again last week as the high CPI report stoked fears that the Federal Reserve’s battle against inflation may last longer than previously affected. Futures markets started the year predicting between six to seven quarter percentage point cuts by the final Fed meeting of this year. Markets are now predicting only one to two, even more pessimistic than the Fed’s last projection of three. Some investors are even more conservative with a 15.8% prediction of no rate cuts at all until early 2025 or later. While the equity market started the year strong, fixed income markets have struggled to make gains following strong performance at the end of 2023. The Bloomberg Aggregate Bond Index fell 1.24% last week alone, contributing to the total loss of 3.43% year to date.
Commodities
Oil prices were surprisingly stable last week as geopolitical turmoil increases in the Middle East. Prices of Western Texas Intermediate spiked nearly $2.00 a barrel on Friday before falling back to previous levels within a few hours. WTI crude actually fell to $85.66 a barrel on Friday from a price of $86.91 a week earlier and continued to fall as of this Monday. Although Iran chose to strike Israel over the weekend, this attack appeared to be less severe than the market feared with speculation that Israel’s potential retaliation will also be mild. Gold followed a similar trend with prices spiking around noon Friday before quickly falling to previous levels. The safe haven investment still appreciated roughly 0.19% last week and is now up 8.74% over the past month.
Interesting Articles
Market Update: April 1 - 5, 2024

Weekly Summary
The bull run in equity markets showed signs of slowing last week though little changed in other markets. Most of the week was spent waiting for US payroll and unemployment metrics released Thursday, which were even stronger than the already optimistic forecasts. Oil prices continue to rise and the trend looks unlikely to reverse as economic data released indicating the US manufacturing industry is expanding. Futures markets continue to predict the first rate cuts coming in June, with three rate cuts in total coming by the end of the year.
Economic Data
On Monday the ISM Manufacturing PMI released at 50.3 versus a forecast of 48.4, with any reading above 50 indicating the US manufacturing industry is expanding. On Wednesday the Euro Area released core inflation at 2.9%, slightly under the forecast of 3.0% and the first time the metric has released at under 3.0% in over two years. The same day ISM services PMI released at 51.4 versus a forecast of 52.7, indicating that the US services industry is also expanding though at a slightly lower rate than expected. The most significant pieces of data released at the end of the week, with US Non Farm payrolls indicating that the economy gained 303,000 jobs in the month of March. This was significantly higher than the expected 200,000 jobs. Unemployment also released slightly lower than the expected 3.9%, at 3.8%
Equities
The S&P 500 began a slight pullback last week after extremely strong performance throughout the first quarter. The index fell slightly on Tuesday and Wednesday, before falling over 2.0% in the final hours of trading on Thursday afternoon. There was no clear catalyst for this minor price crash though it is not uncommon to see high volatility in markets just before and after major economic releases like US employment rate. The market then appeared satisfied with strong unemployment data and a large gain in US payrolls, with the S&P 500 gaining back about 1.1% throughout Friday. The Nasdaq 100 continued the trend of struggling to keep up with the S&P, with many of the tech megacaps now trading sideways after extremely strong performance last year.
Fixed Income
Treasury yields moved little in the first half of last week until falling on Thursday, and then reversing close to previous levels on Friday. Bond yields move inversely to prices, meaning a higher demand for bonds increases prices and decreased yields. The large moves in both equity and fixed income markets could therefore indicate that some institutional investors shifted investments from stocks into bonds Thursday afternoon in anticipation of the earnings report, allowing others to take advantage of lower equity prices and higher bond yields on Friday. Futures markets are still predicting an extremely low chance of a rate cut at the next Federal Reserve meeting on May 1st. However, markets still predict a 57% chance of a rate cut being announced at the following meeting on July 31st.
Commodities
Crude oil prices continued to rise last week spurred by expansion in the manufacturing industry. Prices of Western Texas Intermediate broke above $85.00 a barrel on Tuesday for the first time since last November. Prices continued to rise through the week, hitting highs of around $84.50, before moderating slightly on Friday. Little changed in the Natural Gas market with prices falling about 2% in the first half of last week before returning to previous levels by Friday. Gold prices continued to steadily rise. Gold has now gained 13.5% since the start of this year alone, outperforming even the S&P’s abnormally high gains of 9.7% over the same period.
Interesting Articles
Market Update: March 25 - 29, 2024

Weekly Summary
The first quarter of 2024 came to an end this Sunday with the final trading day falling on Thursday due to market closure for Good Friday. The strong and steady bull run in the equity market continued with the S&P 500 hitting yet another record high close. Headline and core PCE, the inflation measures most closely followed by the Federal Reserve both released at forecasted rates. Natural gas prices remain low while oil prices have begun to tick up after several months of trading in the $70.00 to $80.00 dollars a barrel range. Federal Reserve Chair Jerome Powell is set to give a speech on Wednesday though his messaging is expected to remain consistent with statements given in a speech on Friday.
Economic Data
On Tuesday it was announced that durable goods orders increased by 1.4% in February, higher than forecast of 1.1% and making up some of the -6.9% decrease in January. Durable goods are “hard goods” intended to last at least three years, like home appliances or furniture. This means there’s generally a drop off from December to January as consumers spend less following the holiday season. Annualized US GDP growth for the fourth quarter of 2023 released at 3.4%, higher than the forecasted 3.2% but down from the third quarter’s 4.9%. The most significant piece of economic data came on Friday when the Personal Consumption Expenditure Price Index measure of inflation released at 2.5% as projected. This marks five months in a row that PCE released under 3.0%. The core version of this metric, which excludes food and energy prices and is more closely followed by the Federal Reserve, also matched forecasts at 2.8%.
Equities
It was another strong week for equity markets with the S&P 500 gaining 0.63% from market open Monday to market close Thursday. The index set its twenty second all-time-high close of the year on Thursday and the bull market that began last November shows few signs of slowing down. Thursday’s close marked the strongest first quarter performance by the index since 2019. In previous years where the S&P 500 gained over 8% in the first quarter the index ended the year positive 94% of the time. Another optimistic aspect of this bull run is the fact that ten out of eleven sectors of the S&P 500 had positive returns this quarter. This contrasts with performance through 2023 where nearly all gains were driven by large, tech heavy companies like NVIDIA and Meta. The S&P opened about 0.17% higher Monday after having the weekend to digest the most recent PCE report.
Fixed Income
Five-to-thirty-year treasury yields fell throughout the week before reversing course after market open Monday. While PCE metrics released at projected levels Friday, fixed income markets were dismayed by Federal Reserve Chair Jerome Powell’s message that rate cuts should not be expected until economic growth slows or inflation decreases below the 2.0% target. Futures markets are predicting only a 0.2% chance of rate decreases at the Fed’s next meeting on May 1st. There is currently a 97.8% prediction that interest rates will decrease at least one time by the end of 2024, and the median projection is a decrease of 0.75%. This marks a change from earlier in the year when futures were predicting as many as seven to eight rate cuts before 2024 came to an end. The Federal Reserve has projected a 0.75% decrease since the end of last year and markets seem to finally be adjusting their expectations, rather than bet that the fed is underestimating.
Commodities
Western Texas Intermediate crude oil prices increased from $81.95 a barrel last Monday to $84.28 this Monday. Ukrainian drone attacks on Russian refineries have cast doubt on Russia’s ability to export oil in the coming months, and a combination of higher-than-expected manufacturing demand from China resulted in these price rises. The price of gold continues to rise and hit an all-time high on Monday after already gaining over 7.5% in the past month alone. Natural gas prices remain at multi-year lows following the mild winter with stockpiles roughly 23% higher than this time last year.
Interesting Articles
Market Update: March 18 - 22, 2024

Weekly Summary
Several central banks including the Federal Reserve met last week, which decided to hold interest rates steady and more importantly maintained a projection of three rate cuts by the end of 2024. Both fixed income and equity markets reacted positively to this news after fearing that stickier than expected inflation could cause the Fed to push expectations of rate cuts even further into the future. The Bank of Japan officially ended its experimental negative interest rate policy by increasing interest rates for the first time in seventeen years. The upward trend in oil prices and the downward trend in natural gas prices both moderated after several weeks of high volatility. The Fed’s key inflation gauge, Core PCE, is set to release this Friday.
Economic Data
The Federal Reserve held its March meeting Wednesday of last week and announced their decision to hold interest rates at the current target of 5.25% to 5.50% as expected. The more anticipated piece of information surrounding this meeting was the Dot Plot, a projection of the Federal Open Market Committee’s expectation for interest rates in the medium to long term. Markets were happy to learn that the FOMC is still projecting a decrease of 0.75% in interest rates by the end of the year. The Dot Plot is released roughly every three months at four out of the eight Federal Reserve meetings per year, meaning this is the first projection released since December of last year. Core inflation in the Euro Area released at 3.1% as expected, down from 3.3% in January. Core inflation in Canada fell from 2.4% in January to 2.1% in February and is now finally in range of the Bank of Canada’s 2.0% target. Inflation in Japan increased sharply from 2.2% to 2.8%, reversing the downward trend that began last October.
Equities
Equity markets reacted positively following the Federal Reserve’s March meeting, with the S&P 500 gaining about 1.2% on Wednesday and Thursday. The S&P 600, an index of 600 US companies with significantly smaller market caps, had even stronger performance and gained about 3.1% over the same period. These smaller companies tend to benefit more from an expectation of falling interest rates as they often struggle to negotiate for the more favorable rates sometimes offered to larger companies. Mid cap companies enjoyed the same tailwind to a milder degree and gained 2.5% on Wednesday and Thursday. The financials, energy, and industrials sectors all managed to outperform the overall S&P 500 last week. This was considered an overall positive sign for the economy as these sectors appear to be recovering after poor performance throughout last year.
Fixed Income
Last week US treasury rates fell mildly as the market reacted positively to the Federal Reserve’s unchanged projection for rate decreases across 2024. Several other major Central Banks also met last week, with The Bank of England and Reserve Bank of Australia deciding to hold rates steady at 5.25% and 4.35% respectively. Most notably the Bank of Japan decided to increase their interest rate target from -0.1% to a flat 0.0%. This was the first increase in interest rates by The Bank of Japan in seventeen years and marks the end of an eight-year period of negative rates, a policy that was considered both experimental and controversial by many economists. In the period following World War II Japan underwent rapid economic growth and quickly became the second largest economy in the world. However, over the past thirty years Japan has suffered from abnormally slow economic growth and low inflation compared to other developed economies, causing its GDP to fall behind both China and Germany. In the post covid era both inflation and wage growth have picked up pace, providing the Bank of Japan with an opportunity to finally increase borrowing costs and enter a new era of monetary policy.
Commodities
Western Texas Intermediate crude oil prices peaked last Tuesday at just under $84.00 a barrel, putting a temporary end to the price increases seen since the beginning of this month. Sentiment in the oil market appears to slowly be shifting out of fear that production cuts by OPEC+ and continued unrest in the Middle East may have a more significant long-term impact on prices than previously expected. AAA announced that the national average gas price increased 11 cents last week to $3.52 a gallon as the higher cost of crude continues to filter down to consumers. Gold and silver were mostly flat throughout the week after a strong rally the week prior that brought prices to their highest levels since November. Natural gas prices decreased slightly but are beginning to stabilize after a consistent trend of falling prices that began in early January.
Interesting Articles
Market Update: March 11 - 15, 2024

Weekly Summary
Higher than expected inflation metrics pushed interest rates higher last week but had a surprisingly small impact on equity markets. The S&P 500 closed at a new record high yet again on Tuesday, though the rate of gains seems to finally be slowing down. The Federal Reserve is set to meet this Wednesday the 20th and are near unanimously expected to hold interest rates steady at current target levels. However, new data and statements released by the Fed are expected to shed insight over where rates may be heading throughout the rest of the year. Gold continued to rally, likely driven by Chinese investors searching for safe haven investments, while OPEC+ production cuts and continued unrest in the Middle East is putting upward pressure on oil prices.
Economic Data
On Tuesday the Consumer Price Index measure of inflation released at 3.2%, just slightly higher than the forecasted 3.1%. The core version of this metric, which excludes food and energy prices, released at 3.8% and was also just higher than the expected 3.7%. On Thursday the Producer Price Index measure of inflation followed a similar pattern. Headline PPI released at 1.6% versus the expected 1.1%, while the core version of the metric released at 2.0% versus the expected 1.9%. On Thursday it was also announced that US retail sales grew 0.6% in the month of February, less than the forecasted 0.8%. The following day consumer sentiment calculated by the University of Michigan also released slightly under the expected and previous measure of 76.9 at 76.5. This indicates that US consumers became slightly less optimistic about the state of the economy in the month of February.
Equities
The equity market had another strong week of performance although the bull market that began at the end of last October is beginning to show signs of slowing down. The S&P 500 held flat over the weekend and closed on Monday at roughly the same levels as the previous Friday. Unlike recent CPI misses equity markets did not appear concerned with slightly hotter than expected consumer inflation and the S&P closed at a new record high on Tuesday. The S&P then traded mostly flat Wednesday and Thursday before falling 0.99% on Friday following the negative PPI release. The combination of a CPI and PPI miss helped drive an expectation that inflation may be sticking around for longer than previously expected, which led to outperformance by large, cash heavy companies able to negotiate more favorable interest rates when taking on new debt.
Fixed Income
Inflation readings had a much more noticeable impact on the fixed income market last week. Interest rates rose across the curve with 10-year treasury yields increasing from 4.1% to 4.34% as of Monday. This week the central focus in the fixed income market will be the Federal Reserve meeting set for Wednesday the 20th. The Fed is near unanimously expected to hold short term interest rates steady at the current target rate of 5.25% to 5.5%. More focus will be placed on analyzing statements by Federal Reserve officials for any insights about the path interest rates may head over the rest of the year. We are also set to receive another dot plot this meeting, a survey of the Federal Open Market Committee forecasting where each member expects interest rates to land in the medium to long term. The December dot plot projected three rate cuts, or a decrease of 0.75%, by the end of 2024. With several pieces of employment and inflation data releasing since the December meeting the fixed income market is waiting in anticipation to see if this projection is still the case, or if the expectation of rate decreases has been pushed further out.
Commodities
Western Texas Intermediate crude oil broke above $80.00 a barrel again last week except this time prices settled well above the previous resistance level. This was initiated by an International Energy Agency report that predicted global oil supplies would fall short of demand by 300,000 barrels a day by the end of the year. This deficit was projected because of greater than expected demand in the first quarter, along with OPEC+ cuts and shipping disruptions in the Red Sea curbing output on the supply side. The price of gold and silver continued to rise early last week but stabilized and moved little throughout the rest of the week. Gold has now gained 11.23% in value over the past six months and is up 17.86% from the lows reached in October of last year. There is no clear consensus over what forces are driving this rally in gold, but many economists believe it’s largely the result of Chinese investors moving money out of struggling equity and real estate as these domestic investments continue to underperform much of the rest of the world.
Interesting Articles
Market Update: March 4 - 8, 2024

Weekly Summary
Equity markets hit new all-time highs again this week, but prices contracted on Thursday and Friday leading to a week over week loss. Consistent messaging by Federal Reserve Chair Jerome Powell, along with a slight increase in unemployment, led to decreases in interest rates and helped solidify the path for interest rate cuts sometime this year. Energy prices remained stable and under historic seasonal averages while precious metals continued the trend of slow price increases due to the expectation of coming rate cuts. This Tuesday and Wednesday the Consumer Price Index and Producer Price Index measures of inflation are set to release.
Economic Data
On Tuesday the ISM Services PMI reading released at 52.6, close to the forecast of 53. Any reading above 50 indicates that the services sector of the economy is expanding. On Wednesday the Bank of Canada announced their decision to hold interest rates steady at 5% as expected, compared to Federal Reserve’s current target of 5.25%-5.50%. The following day the European Central Bank also decided to hold rates steady at 4.5%. Friday was the busiest day for economic releases with the Euro Area announcing 0% GDP growth over the past twelve months. US payrolls increased by 275,000 in the month of February, significantly higher than the forecast of 200,000. However, unemployment moved in the opposite direction, increasing to 3.9% from the previous reading and forecast of 3.7%. Unemployment climbing closer to 4.0% is expected to put further pressure on the Federal Reserve to decrease rates sooner rather than later. In recent years we’ve often focused on the Fed’s responsibility to keep inflation stable, but their dual mandate states that they must put equal focus towards maintaining maximum employment.
Equities
The winning streak in the equity market showed signs of slowing last week. The S&P 500 fell 1.11% from the previous Friday until Tuesday before reversing course on Wednesday and Thursday to hit another record high close. This is now the eighth week in a row that the index has closed at a new daily record high. However, poor performance through Friday and this weekend resulted in an overall weekly loss of 0.75%. The more volatile, tech heavy Nasdaq 100 fell about 2.07% over the same period. While we would always prefer to see positive returns in any market, it’s important to consider all the context surrounding this data. As of Monday, these two indexes are up 7.4% and 7.2% respectively year to date. In just slightly over two months the S&P 500 is already approaching the historic average yearly return of 10.26%. Slight pullbacks after several weeks of strong returns are also often considered positive or neutral as they imply the market is continuing to move on fundamentals such as earnings multiples, rather than speculation or a “fear of missing out” which are often associated with more extreme downward corrections.
Fixed Income
The main topic of discussion last week in the fixed income market surrounded Federal Reserve Chair Jerome Powell’s semiannual testimony before congress. As expected, Powell stuck closely to his previous talking points and remarks. He stated that it was extremely unlikely that there are any rate increases on the horizon and that “it will likely be appropriate to begin dialing back policy restraint at some point this year.” He also stated that the Federal Reserve does not believe we are currently in a recession and that the short-term risk of falling into a recession is extremely low. Another topic he touched on is concerns surrounding regional banks’ concentrations in commercial real estate loans, an industry that is still struggling to recover from the work at home boom during pandemic shutdowns. None of these remarks came as a surprise and the consistency in messaging decreased uncertainty in the market, leading to a mild decrease in medium term rates. Futures markets are currently predicting a 71.9% chance of rate cuts coming by the June Federal Reserve meeting, slightly up from the 69.1% probability the week before.
Commodities
Oil prices fell last week after breaking the $80.00 per barrel resistance level the previous Friday. Prices have ticked up slowly over the past three months but remain in a stable range of $70.00 to $80.00 a barrel, compared to a peak of about $94.00 a barrel in October of last year. Oil prices are still not expected to increase in the short term due to low manufacturing demand from China as well as US demand currently 2.5% below the seasonal average. Natural gas prices also changed little and remain lower than average following warm weather across the east coast as we head into spring. Gold and silver continued the pattern of slow price increases that began at the end of last month. Non yielding assets (like gold or zero-coupon bonds) tend to respond very positively to an expectation of future rate cuts because yielding assets (like US treasuries) become a less competitive alternative to invest in.
Interesting Articles
Market Update: February 26 - March 1, 2024

Weekly Summary
The major topic of discussion last week was the release of Core PCE on Thursday, the measure of inflation followed most closely by the Federal Reserve. Core PCE released at 2.8% as expected, a positive sign for investors hoping that interest rate cuts will come sooner rather than later this year. Both equity and fixed income markets posted positive returns while energy prices ticked towards a return to more average seasonal levels after several weeks of abnormally low prices. Federal Reserve Chair Jerome Powell is set to make his semiannual testimony before Congress this Wednesday and Thursday. Politicians on both sides of the aisle are expected to pressure Powell towards their desired policy decisions as the election season grows closer.
Economic Data
Several major US economic indicators released last week. On Wednesday US GDP growth was reported at 3.2%, just slightly under the forecast of 3.3%. While GDP growth is generally a positive for the economy, the potential upside of this reading is that monetary policy by the federal reserve may be cooling the economy as intended to reduce inflation. The largest release was on Thursday, when the US Personal Consumption Expenditures Price Index released at the expected 2.4%. Core PCE, the metric most closely followed by the Federal Reserve, also released at the expected 2.8%. This marks the second month in a row where Core PCE released under 3.0%, inflation rates that have not been seen since March of 2021. Finally, on Friday Euro Area core inflation released at 3.1%, slightly higher than the forecast of 2.9%. US employment data set to release this Friday is likely to have a major impact on Federal Reserve messaging heading into their meeting later this month.
Equities
Last week was another in a long streak of positive performance in the equity market. The S&P 500 has now hit a record high seven weeks in a row and has had already hit a record high daily close fifteen times so far this year. Over 90% of companies in the S&P 500 have now reported Q4 2024 earnings, with average revenue growth at 3.8% and average net income growth at an even higher 7.5%. Several of the so called “Magnificent Seven,” a group of mega-cap stocks that drove the majority of US equity gains last year have begun to underperform the overall market. In February NVIDIA, Meta, and Amazon drove the bulk of gains within this group. This can be taken as a sign that investors are shifting money away from these major tech companies into the rest of the US equity market, a positive sign for overall market resilience. Late in the week computer chip manufacturer NVIDIA overtook energy company Saudi Aramco to become the third largest publicly traded company by market cap in the world.
Fixed Income
After the positive PCE release fixed income markets reversed course, with interest rates decreasing following several weeks of rate increases that began in late January. This week much of the focus in the fixed income market will center around Fed Chair Jerome Powell’s semiannual testimony before Congress. Powell is expected to continue the overall messaging expressed at the last two Federal Reserve meetings, that rate cuts are likely to come sometime this year but not until more evidence suggests inflation is likely to hold steady close to the 2.0% target. With the election approaching Federal Reserve policy has become more and more of a political issue, with Democrats fighting for rate cuts before the election to attempt to boost the economy while Republicans are pushing for more stringent capital requirements among major banks. Futures markets are currently predicting a 69.1% chance that the first rate cuts will come by the Federal Reserve’s June meeting.
Commodities
Oil prices ticked upward last week after OPEC+ announced the widely expected decision to maintain output cuts in an attempt to bolster prices. Following this announcement the primary North American oil benchmark, Western Texas Intermediate, increased in price to over $80.00 a barrel for a short period on Friday. This was the first time since November of last year that this resistance level was broken. Natural gas prices recovered slightly after falling to abnormally low levels the week before. Further price increases came this Monday after US energy company EQT Corporation announced an output curtailment through March. Despite this natural gas prices are still far below average historical levels following a mild winter that resulted in extremely high storage levels. Gold prices were mostly flat throughout the week until a mild increase following Thursday’s PCE release, with slight price increases continuing through the weekend.
Interesting Articles
Market Update: January 29 - February 2, 2024

Weekly Summary
Last week nearly all attention was focused on the Federal Reserve’s Wednesday meeting. The Federal Reserve decided to hold rates steady as expected, but some comments by fed officials changed market outlooks for the next meeting in March. US employment data released and was much more optimistic than expected, another sign that the US economy is still strong. Markets had a negative initial reaction following the Federal Reserve meeting but largely reversed course on Thursday and Friday with the S&P-500 ending the week up about 0.6%. Oil continues to trade in the $70 range but fell to the lower end last week after rising the week before.
Economic Data
On Tuesday Euro Area annual GDP growth was reported at only 0.1%, but still higher than the forecasted 0.0% growth. US consumer confidence was reported at 114.8 versus the predicted 115, meaning consumer confidence is higher than average but slightly lower than economists previously believed. On Wednesday the federal reserve released their decision to hold rates steady at current levels as the market predicted. On Friday US employment data was released, showing that US payrolls had increased a staggering 353K in the month of January, significantly higher than the predicted 180K. Unemployment was also slightly lower than expected at only 3.7% versus the predicted 3.8%.
Equities
Major companies continued to report fourth quarter earnings last week with the earning season now about halfway over. One notable example was Meta, the owner of Facebook and Instagram, which announced the company’s first ever dividend and reported significantly higher than expected net income. This resulted in a 20% stock price surge, or a $197 billion increase in the company’s value. This made news as the largest single day value increase of a single company in the history of the stock market. In February of 2022 Meta also had the largest loss in value in the history of the stock market when the company’s value fell over $200 billion in a single day. Equity markets seemed neither impressed nor upset at the Federal Reserve’s decision to hold rates steady, with the S&P-500 losing about 1.63% on Wednesday but gaining 2.38% back in the following two days.
Fixed Income
The main topic of interest in the fixed income market last week was the Federal Reserve’s Wednesday meeting. The Federal Reserve decided to keep current rates steady as the market had overwhelmingly predicted, so most discussion centered around comments made by Chair Jerome Powell and other Federal Reserve officials. Powell seemed to shoot down the idea of rate decreases at the next meeting in March, making the statement that “We’ve had inflation come down without a slow economy and without important increases in unemployment. There’s no reason why we should want to get in the way of that process if it is going to continue.” Markets had previously predicted that a rate cut in March was more likely than not, but now only see about a 15% chance that will occur. However, markets are still predicting about a 62% chance of a rate cut coming at the following meeting in May.
Commodities
Oil markets continue to see little concern about the current unrest in the Middle East with barrels of WTI crude falling from the high $70 dollar range to the low $70 range last week. WTI is now at its lowest price in nearly a month and markets appear to believe that high supply and reserves can counteract any potential losses due to military escalation in Yemen, Syria, and Iran. Natural gas prices remain low despite volatile weather patterns, possibly because of low commercial demand as European economies continue to struggle. In the month of December US liquified natural gas exports reached an all time high, another example of domestic energy production remaining robust. The price of gold spiked following Powell’s comments about the March meeting, but quickly returned to previous levels.
Interesting Articles
Market Update: January 8 - 12, 2024

Weekly Summary
Last week was fairly slow across markets with most anticipation focused on the release of two major US inflation metrics on Thursday and Friday. These inflation readings sent what most considered to be mixed signals, but the long-term outlook on US inflation still appears optimistic and markets were overall unphased. Equity and Debt markets reversed some of the previous week’s losses early in the week and then held onto these gains through the long weekend until market open this Tuesday. Escalations continue to rise in the Middle East with the US and UK taking action against Houthi militants for the first time, though so far this does not appear to have had any major impact on oil or other commodity prices.
Economic Data
Last week was noneventful when it came to economic data for the rest of the world, with Mexico reporting inflation of 4.66% versus the expected 4.55% on Tuesday. Markets spend the week waiting in anticipation for the Consumer Price Index release Thursday, the measure of inflation most commonly cited in the news. The December reading of this metric reported that prices had increased 3.4% over the past year, higher than the expected 3.2%. The core version of CPI, which excludes volatile food in energy prices, released at 3.9%, slightly closer to the predicted 3.8%. The Producer Price Index, a measure of inflation related to spending by companies rather than individuals, released the following day and sent the opposite message. Headline PPI was reported at only 1.0%, even lower than the expected 1.3%. This was also not simply the result of low energy prices considering that core PPI still released under the expected 1.9% at 1.8%. This helped moderate some of the fear that inflation may be picking up again as companies will likely pass on some portion of these savings onto consumers in the long run.
Equities
The equity markets were fairly calm last week compared to the more volatile two weeks prior. Equity markets boomed over the weekend with the S&P 500 gaining over 1.4% on Monday alone, reversing nearly all loses from the previous week. Equity markets then made small gains throughout the week until panicking after the negative CPI inflation reading on Thursday. Stocks fell slightly over 1.0% in the first half of the trading day, but the momentum reversed after noon and nearly all loses were reversed by the time the market closed. The S&P 500 eventually ended the week up slightly from Monday’s open and held these gains through the weekend to market open this Tuesday.
Fixed Income
Fixed income markets also had mild but positive performance last week. Interest rates fell across the yield curve, most notably with three-to-ten-year treasury rates all falling below 4.0%. The next Federal Reserve meeting is now only about two weeks away and market consensus still appears to be that Fed officials will leave the meeting with rates unchanged. Futures markets are in near unanimously belief that rate cuts will come at one of the following three meetings, with a cut by March predicted at 66.8% and a cut by June predicted over 99.9%. Rates across the curve rose back to last Monday’s levels this Tuesday after Federal Reserve Governor Christopher Waller made comments implying that cuts may not be coming as quickly as the market appears to be predicting.
Commodities
Oil has continued to trade in the $70.00 to $73.00 a barrel range despite escalating tensions in the Red Sea, with the US and UK finally deciding to take action against Houthi militants attacking shipping vessels after several weeks of warnings. These attacks have been ongoing for about two months now and have caused many commercial vessels to re-route, disrupting global trade and increasing shipping costs. Natural gas prices rose throughout last week as weather this January has continued to be significantly colder than previously predicted. Gold was largely flat last week outside of a minor boost following Thursday’s inflation release. The SEC aproved the creation of Bitcoin spot ETFs for the first time last week, allowing investors to trade the cryptocurrency on American equity markets for the first time.
Interesting Articles
Market Update: February 5 - 9, 2024

Weekly Summary
It was an overall slow week for markets as investors await inflation data set to release Tuesday of this week. Equity markets steadily continued their winning streak, but long-term interest rates increased slightly following the cautious statements made by Federal Reserve officials the week before. Oil prices increased slightly, likely due to markets finally taking unrest in the Middle East seriously and more than just a short-term issue. China continues to struggle with deflation while the Canadian economy is beginning to show signs of strength, positive news for the closely intertwined US economy.
Economic Data
On Monday ISM Services PMI was released at 53.4 versus the expected 52, with a reading above 50 indicating that the services section of the economy is expanding. Wednesday inflation data for China released at -0.8%, even worse than the expected -0.5%. As we’ve discussed in some quarterly updates, deflation is often even more dangerous for an economy than high inflation. This is because deflation gives consumers incentive to save rather than spend, leading producers to lower their prices even further. This is often referred to as a “deflationary spiral” and is worrisome for China’s economy in the coming months. Employment data for Canada released on Friday, showing that 37.3k jobs were added in the month of January. Canadian unemployment is currently 5.7%, significantly higher than the US rate of only 3.7%, but still lower than the expected 5.9%. This Tuesday the Consumer Price Index is set to release, one of the most significant measures of US inflation.
Equities
The equity market continued its upward trend last week with the S&P 500 gaining nearly 4% and holding its gains through the weekend to this Monday. Most notably the index closed above the level of its close the previous Friday, another sign that equity markets have a positive view of major company’s performance over the next several months. Small cap companies performed particularly well. The S&P 600, an index measuring the stock price of 600 American companies with low market caps, gained over 4.6%. These companies often have difficulty acquiring loans at the more favorable interest rates that large companies are able to, meaning a decrease in interest rates will be especially beneficial to them going forward.
Fixed Income
Rates increased in the long-term end of the yield curve last week following the Federal Reserve’s comments implying that rate cuts would not be coming as soon as March. Futures markets are still predicting about a 60% chance that rate cuts will come at the following meeting in May, though these markets are often volatile surrounding inflation readings like the one that will release this Tuesday. The Federal Reserve previously projected that three rate cuts will come by the end of this year, which would result in short term interest rates falling by three quarters of a percent. Futures markets are slightly more optimistic and believe rates will fall somewhere between 1.0%-1.25% by the final Federal Reserve meeting in December.
Commodities
Last week was relatively slow in the commodity markets as well with gold trading mostly flat and falling about 0.2% from Monday to Friday. Unrest in the Middle East appears to finally be having an effect on oil prices with crude oil increasing about 3.6% through the week. However, price gains are being counteracted by a belief that high interest rates will continue to weigh on the energy and manufacturing in industries. OPEC+ has maintained a forecast that demand for oil will increase in 2024 and 2025 as interest rates finally fall. OPEC+ is currently set to meet in March to decide whether to extend current production cuts. Natural gas prices fell however, a pattern common in the spring as demand for heating decreases due to milder weather.
Interesting Articles
2023
Market Update: December 4 - 8, 2023
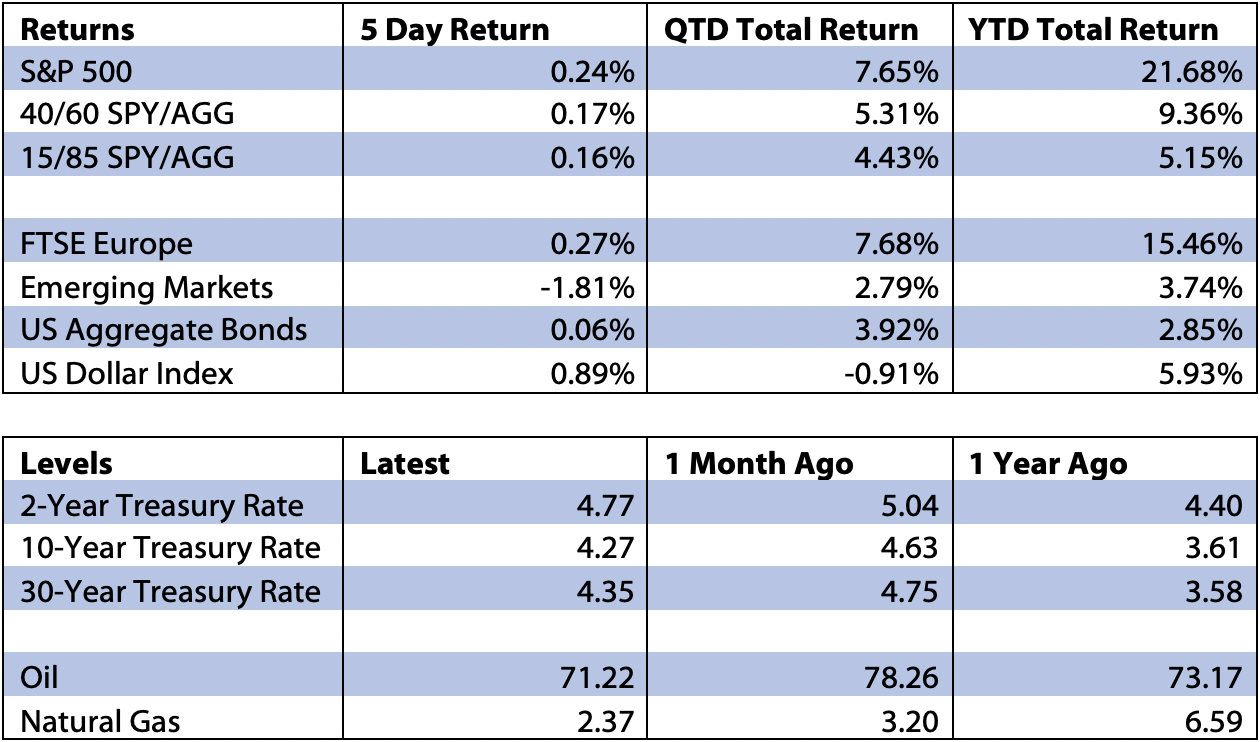
Weekly Summary
Last week was another slow week across markets, though when it comes to investing no news is often good news. Unemployment released at lower-than-expected levels while new job payrolls were higher than expected. This was considered positive news by equity markets and long-term fixed income, while short term rates rose out of an expectation that the Federal Reserve may keep rates higher for longer than previously expected. Oil and Natural gas continued their downward trend after weather forecasts were revised to predict an even milder winter, and demand in China was projected to be lower than expected. Key inflation measures release this Tuesday and Wednesday, and the Federal Reserve will announce their interest rate decision at their final meeting of the year on Wednesday afternoon.
Economic Data
There were only a few major pieces of economic data released last week as markets wait in anticipation over US inflation data releasing this Tuesday and Wednesday. The Bank of Canada decided to hold rates steady at 5.0% as expected, while the Euro Area reported annualized GDP growth of -0.1% in the third quarter of 2023, compared to growth of 5.2% in the US. US employment data released Friday with both new payrolls and unemployment more optimistic than expected. One aspect currently helping employment data is the end of strikes and union disputes in the Auto and Entertainment industries. This Tuesday US CPI, a consumer measure of inflation, will release while PPI, a measure of inflation relating to companies’ expenses, will release the following day.
Equities
Last week equities continued the slow and steady progress that began in late October. The S&P 500 has gained slightly over 12.2% since this rally began and the tech heavy Nasdaq 100 gained over 14.5% during the same period. December is historically a strong month for equity markets and the trend has continued so far this year. The S&P 500 index is now only about 4.5% under the all-time high reached in January of 2022. If markets continue to follow the trend of the past several weeks we can expect to see the index reach a new all-time high as soon as early to mid-January. Equity markets performed surprisingly well after positive employment data released on Friday. Abnormally, this market cycle equities have often reacted negatively to positive employment data as it pushes the expectation of rate cuts further into the future. With this rate cycle predicted to soon end, markets appear to finally be returning back to more normal behavior.
Fixed Income
After several weeks of falling rates across the yield curve we finally saw an increase in rates under ten years after employment data released Friday. However, twenty- and thirty-year treasury rates continued to fall. This could be seen as predicting a “higher for longer” strategy by the federal reserve, where rates would be eventually expected to fall, but may stay steady at current levels throughout 2024 if there are no further signs of an approaching recession. Futures markets are currently predicting about a 39.9% chance of rates decreasing by the end of March, and a 71.4% chance that rates will fall by early May.
Commodities
Fear surround OPEC+’s ability to control oil prices, along with lower-than-expected projected demand from China, caused oil prices to fall again last week. Natural gas prices were mostly flat like the week before, but prices fell nearly 10% this morning in reaction to warmer than expected weather forecasts released over the weekend. US natural gas stockpiles are currently 7.3% higher than this time last year and 6.7% higher than the five-year average for December. The dollar reversed from its previous trend and had a mild rally resulting in a decline in gold prices. Gold then fell an additional 1.5% on Friday after employment data released.
Interesting Articles
Market Update: November 27 - December 1, 2023

Weekly Summary
Several key pieces of economic data were released last week that implied inflation in the US and Euro Zone is continuing to moderate as hoped by the Federal Reserve. Both equity and fixed income markets were slow heading into this week but reacted positively to the release of these inflation metrics on Thursday and Friday. Natural gas prices fell early in the week but returned to previous levels, while oil prices decreased slightly after an OPEC+ meeting signaled that the cartel may have difficulty coming to agreements in the future.
Economic Data
The most significant piece of economic data released last week was the Personal Consumption Expenditures Price Index. The core version of this index, which excludes volatile food and energy prices, is the Federal Reserves preferred measure of inflation and is therefore followed extremely closely by investors. Both core and headline PCE released at the expected rates of 3.5% and 3.0%, respectively. Core inflation in the Euro Area released the same day at 3.6%, under the forecasted 3.9%. Another metric of US inflation, the Consumer Price Index, is set to release December 12th, one day before the Federal Reserve makes its final rate decision of the year.
Equities
As stated earlier, the first half of the week was very slow for equity markets but a positive reaction to inflation readings led to strong performance on Thursday and Friday. This capped off what has been an excellent month of performance across equity markets, with the Dow Jones Industrial Average now posting gains for five weeks in a row. Previously underperforming segments of the market like small and mid cap stocks overperformed ending the week up about 3.5% and 2.9%, compared to 0.9% for the large cap S&P 500. The S&P 500 then reversed some gains this Monday but has still appreciated about 4.8% in value over the past month.
Fixed Income
Fixed income rates fell across the yield curve last week following the inflation data releases, driving bond prices up. These inflation metrics releasing at or below expected levels near unanimously solidified the consensus that interest rates have already peaked at current levels. Futures markets are now making a 99.7% prediction that there will be no rate increases at the December Federal Reserve meeting, and a 0.3% chance that rates may even be decreased. By the March meeting the probability of a rate decrease from current levels is 58.1%.
Commodities
Last week the main driver of oil prices was an OPEC+ meeting that was previously delayed. The cartel announced further production cuts but that these cuts would be “voluntary,” signaling that OPEC+ countries may have difficulty coming to agreements in the future. Perhaps most notable was Angola’s statement that it will not comply with these production quotas. This resulted in oil prices falling slightly unlike the usual price increases that follow OPEC+ production cuts. Natural gas prices fell early in the week but then increased back to previous levels. The US has continued to increase exports of natural gas, but reserves in Europe are starting to fall as the continent finally begins to experience winter weather. Gold and silver performed well again last week as the dollar has continued to depreciate in comparison to other currencies.
Interesting Articles
Market Update: November 20 - 24, 2023

Weekly Summary
Last week was fairly uneventful with markets closed on Thanksgiving and only open for a half day on Black Friday. This Thursday the Personal Consumption Expenditures Price Index measure of inflation will release. PCE is the preferred inflation measure of the Federal Reserve and the release will have a major impact on whether the Fed decides to increase interest rates again this cycle. Inflation data for the Euro area will release the same day and is also likely to have an impact on markets, although to a lesser extent than PCE.
Economic Data
Last week Canada reported inflation of 3.1% versus the expected 3.2%. This was considered a positive sign for upcoming US inflation metrics because the two economies are so closely intertwined. The following day US consumer sentiment released at 61.3 versus the expected 60.5, with any reading above 50 indicating consumer sentiment is becoming more positive. Consumer sentiment tends to be considered even more important as we approach the end of the year as holiday spending is often viewed as an indicator of the current state of the economy.
Equities
Equity markets performed well on Monday with the S&P-500 gaining about 0.99%. Some of these gains were reversed the following day but the index ultimately ended the week up 0.84%. The tech heavy Nasdaq-100 also performed well ending the week up 0.86%, then gaining an additional 0.25% as of this Monday afternoon. Equity markets are expected to be more volatile than normal following the PCE release before markets open on Thursday. Previously underperforming portions of the equity markets performed well after the Consumer Price Index measure of inflation released at lower-than-expected levels earlier this month. If PCE follows the same pattern we may see a similar performance from investments such as small cap and emerging market stocks.
Fixed Income
Last week fixed income markets were even less volatile than equity markets. Short term interest rates increased slightly, with the two-year treasury yield increasing from 4.88% to 4.94%. Long term rates were essentially unchanged after dropping earlier this month following the CPI release. As the next Federal Reserve meeting draws closer the probability of a rate hike in January or March has slightly increased. This is fairly normal as many investors use the future contracts used to determine these probabilities as a hedge in an attempt to limit potential losses in the case that interest rates increase. Despite this there is still only a 6.9% prediction that rates will increase at the January meeting early next year, and an even lower probability that rates will increase at any of the following meetings next year.
Commodities
Oil prices continued to slowly fall last week and fell even further Monday morning after it was announced that an OPEC+ meeting was delayed until later in the week. OPEC+ countries produce about 40% of the world’s crude oil and are able to have a large effect on oil prices by increasing or lowering production. OPEC+ has limited production since last November driving oil prices higher but is currently expected to increase production sometime next year. Gold and silver performed well last week as the dollar has continued to weaken in comparison to other currencies.
Interesting Articles
Market Update: November 13 - 17, 2023

Weekly Summary
Both equity and fixed income markets rallied last week after the release of unexpectedly low inflation data. As inflation continues to fall the possibility of a so called “soft landing” appears to be more and more realistic, meaning the Federal Reserve will be able to slow the economy without a large increase in unemployment. Markets are in near unanimous agreement that interest rates have peaked this cycle and will fall within the next year at the latest. This week can be expected to be slower than normal with markets closed completely for Thanksgiving and closing early on Black Friday.
Economic Data
Last week all eyes were on the release of two key inflation measures. On Tuesday the Consumer Price Index released at 3.2%, just under the forecast of 3.3%. Core CPI, which excludes volatile food and energy prices, also released below expectations at 4.0% versus the forecasted 4.1%. The next day the Producer Price index released even further below expectations at only 1.3% versus the forecasted 1.9%. With unemployment still low these inflation readings were an excellent sign for the economy and strengthened expectations that interest rates have peaked at current levels. The Personal Consumption Expenditures Price Index, a measure of inflation preferred by the Federal Reserve, will release November 30th giving the Fed two weeks to analyze the data before their next meeting on December 13th.
Equities
Lower than expected inflation readings caused an extreme rally in the equity market with the S&P 500 up almost 2% on Tuesday alone. The positive PPI release the following day resulted in another small boost to the markets which held through the rest of the week and weekend. Previously underperforming sections of the market also performed well with small cap stocks gaining over 5.0%. Overall November has been an excellent month for equity markets across the board and the S&P 500 is quickly approaching the highs reached in July of this year.
Fixed Income
Fixed income markets also performed well with interest rates falling across the yield curve. We recently made the decision to extend the duration of one of our portfolios, meaning the average length of bonds held was increased. Locking in these high rates for longer periods of time will result in higher performance in the event that rates continue to fall as they did last week. Low inflation readings also decreased expectations that the Fed will continue to increase interest rates. Futures markets now predicting only a 2.1% chance of a rate increase this cycle and expect interest rate cuts from the Fed as early as the middle of next year.
Commodities
Oil prices fell late last week but quickly recovered to the previous week’s prices over the weekend. Natural gas prices followed a similar pattern but continued to fall on Monday resulting in the lowest prices in over a month. Low inflation data resulted in a weaker dollar which caused the price of both gold and silver to rally. Notably gold broke over the $2,000 per ounce range which has recently been seen as a point of psychological resistance.
Interesting Articles
Market Update: November 6 - 10, 2023

Weekly Summary
Last week was fairly slow when it came to economic releases and market performance. However, this week is expected to be more volatile due to two key inflation measures releasing Tuesday and Wednesday. The most notable surprise last week was weaker than expected consumer sentiment in the US, a potential indicator that the US economy is cooling after unexpectedly high growth last quarter. Overall markets were more calm than normal last week with equity indexes performing well and energy prices falling in a positive sign for short term inflation.
Economic Data
On Tuesday inflation data for China released at -0.2%, slightly lower than the forecast of -0.1%. China is one of the few major economies that is currently facing deflation rather than inflation due to an abnormally weak demand for manufactured goods and a struggling real estate sector. Few other major pieces of economic data released last week, though US consumer sentiment was weaker than expected. This is a further piece of evidence that consumer spending is decreasing and should help slow price increases due to weaker demand. This Tuesday the US consumer price index, a major measure of inflation, will release and is likely to have a strong impact on the Federal Reserve’s final meeting of the year in mid-December. The following day the producer price index will release, a measure of inflation relating to companies rather than consumers. The producer price index is often seen as a leading indicator for consumer inflation as companies tend to pass on short term price changes to customers.
Equities
The upward trend in equity markets continued last week following strong performance the week before with the S&P 500 ending the week up 1.1%. The tech heavy Nasdaq-100 also performed well after several strong earnings reports finished off the third quarter. Weak consumer sentiment did not seem to affect equity markets on Friday though the S&P did reverse some of its gains over the weekend. Despite this the index is up over 6.9% from the lows reached in late October and if the rally in equity markets continues the S&P will soon approach the all-time highs achieved in January of 2022. On Friday Moody’s, one of the three major credit rating agencies, suggested it may downgrade the US due to concerns over a growing budget deficit and potential government shutdown. This was expected to put downward pressure on US equity prices though as of Monday morning it appears to have had little effect. Equity markets should be expected to be more volatile than average this Tuesday and Wednesday surrounding the release of inflation data.
Fixed Income
Fed Chair Jerome Powell made two public speeches last week and appeared to downplay some of the more optimistic remarks made after the previous week’s Fed meeting. Powell emphasized that the Federal Reserve is “not confident” that current rates will bring inflation back to the 2% target, echoing remarks made by Fed officials after policy decisions earlier this year. This resulted in futures markets predicting a slightly higher chance of further hikes this cycle with the probability of a rate increase by January now over 25%. Climate activists have repeatedly attempted to disrupt Powell’s public statements in the past several weeks although the most recent interruption was considered a minor distraction and Powell was later able to finish his remarks. Long term rates were largely unchanged last week after falling dramatically the week before, though “medium term” rates in the two-to-ten-year range rose slightly.
Commodities
Oil prices fell again last week after weaker than expected demand was predicted in both the US and China. West Texas Intermediate Crude Oil, often abbreviated as WTI, is now trading significantly lower than the long-term estimate of $82.00 at only $77.50 per barrel. Natural gas prices also fell as investors continue to bet that weather will be milder this winter than in previous years. The price of gold and silver fell slightly but could see major gains this week if inflation comes in higher than expected. While gold itself is not an income producing asset its often used by investors to diversify portfolios and is seen as a defensive investment against high inflation.
Interesting Articles
Market Update: October 30 - November 3, 2023

Weekly Summary
Markets were optimistic heading into Wednesday’s Federal Reserve meeting following the release of mild inflation data and strong GDP growth the previous week. The Federal Reserve made the decision to hold rates steady as expected, and Fed Chair Jerome Powell made statements at the following press conference that were perceived as hinting towards a lower chance of rate hikes in the future. This, along with Friday’s unemployment release, caused long term fixed income rates to drop significantly while equity markets had their strongest week so far this year. Commodity prices were flat with the price of oil, natural gas, gold, and silver all largely unchanged.
Economic Data
As we transition into November several key pieces of macro-economic data for the month of October were released. On Monday Germany surprised economists by reporting an annualized GDP decrease of 0.3% versus the expected decrease of 0.7%. Inflation in Germany also fell from a 4.5% annualized rate in September to a 3.8% in October, lower than the expected 4.0%. Manufacturing demand was slightly lower than expected in China putting mild downward pressure on energy prices while the Bank of Japan decided to leave its short-term interest rate target at -0.1%. The following day the Euro Area released core inflation readings at the expected 4.2% annualized rate but had a weaker than expected GDP growth rate of 0.1% versus 0.2%. On Friday the US announced that unemployment had increased slightly in October from 3.8% to 3.9%. This week inflation data for China and GDP growth for the United Kingdom are both set to release.
Equities
US equity markets had their best week of the year so far with the Dow Jones Industrial Average and S&P 500 both gaining over 5.0% while the Nasdaq Composite gained over 6.5%. The stock market started the week off strong following the previous week’s release of abnormally strong GDP growth despite cooling inflation, then finished even stronger after the US reported slightly higher than expected unemployment on Friday. While increasing unemployment would traditionally be seen as a negative sign for the economy, this report was considered a positive for equity markets in the short term as it implies that the Fed is making progress towards its goal of slowing down the economy and continuing to reduce inflation. Over 80% of companies in the S&P 500 have now presented third quarter earnings reports and earnings within the index are currently on track to increase 5.7% from a year earlier. Major companies reporting earnings this week include Disney, Warner Bros. Discover, MGM Resorts, and Uber.
Fixed Income
Long term rates fell dramatically last week, breaking the trend of consistent increases that began in early September. This was initially driven by the Fed hinting that rising long-term yields may reduce the need for further hikes this cycle, then accelerated after higher-than-expected US unemployment was announced on Friday. Both the Federal Reserve and Bank of England followed the European Central Bank by leaving rates unchanged at 5.5% and 5.25% respectively. Official statements by the Federal Reserve during policy meetings have remained largely unchanged over the past several months, but responses by Fed Chair Jerome Powell shortly after last week’s meeting imply that may soon change. During a press briefing Powell stated that “The question we’re asking is: Should we hike more?” and that “Slowing down is giving us […] a better sense of how much more we need to do, if we need to do more.” These statements were considered less ‘hawkish’ than previous responses by Powell, meaning that the Federal Reserve is expecting a low chance of further rate increases this cycle.
Commodities
Oil prices were less volatile last week compared to earlier this month, trading in the $81.00 to $83.00 a barrel price range as investors become less concerned about the potential impact of the Israel-Hamas conflict. Natural gas prices rose slightly late last week before falling to previous levels this Monday morning after it was announced that Europe’s natural gas storage is at a record high despite falling temperatures across the continent. Gold and Silver prices remained steady for the second week in a row after a mild rally in precious metals that began in early October.
Interesting Articles
Market Update: October 23 - 27, 2023

Weekly Summary
Last week the Bank of Canada and European Central Bank decided to keep interest rates steady in a signal that they believe inflation is moderating beyond the US. US GDP growth for the third quarter was much higher than expected while PCE inflation readings released at expected levels. This has led to optimism going into the Federal Reserve meeting this Wednesday where US rates are also expected to remain steady. Long term fixed income rates rose again last week although less dramatically than in the previous two weeks. This continues to put pressure on equity markets that must compete with a higher guaranteed return, and to consumers and companies through a higher cost of personal and corporate debt. Oil prices are still somewhat more volatile than normal, but prices fell last week as fears over the Israel-Hamas conflict’s global impact begins to moderate.
Economic Data
On Monday inflation in Australia released at 5.4% versus the expected 5.3%, but still down from last month’s 6.0% reading. On Wednesday the Bank of Canada announced they would hold interest rates steady at 5.0% for the third meeting in a row. The following day the European Central Bank announced they would also leave their 4.5% rate unchanged at the first ECB meeting without a rate increase in over a year. This coming Wednesday the Federal Reserve will announce its interest rate decision and is also expected to hold rates steady. US GDP grew at a 4.9% annualized rate in the third quarter, far higher than both the predicted 4.3% and the second quarter growth rate of 2.1%. Finally, both the headline and core Personal Consumption Expenditure Index measures of inflation released at the expected 3.4% and 3.7% respectively. These final two pieces of economic data, along with a currently low unemployment rate, imply that the US economy is still strong and defying previous predictions of a recession.
Equities
Equity markets were down again this week with the S&P-500 losing 2.4% and the NASDAQ-100 down 2.9%. As of this Monday many of these losses were reversed with both indexes gaining back over 1.1% over the weekend. Several major tech companies including Microsoft, Alphabet, Meta, Intel, and Amazon reported earnings last week with all besides Intel reporting higher than expected revenue and income. Despite this equity markets struggled to compete with long term fixed income investments with 10-year treasuries yields now hovering near the 5.0% range. However, short term interest rates seemingly coming to a peak, resilient economic growth, decreasing inflation, and strong corporate earnings paint an optimistic picture for equity markets in the coming months.
Fixed Income
Long term rates rose again last week although the change was far less dramatic than the week before. 30-year treasury yields remained over 5.0% while the 10-year traded in the 4.8% to 4.9% range, occasional breaking over the 5.0% milestone. The opportunity to lock in these long-term returns have put pressure on equity markets and borrowers. Higher long-term rates are passed on to consumers through increased rates on mortgages and other forms of debt, and to companies that must issue bonds at rates that can compete with treasuries. Under current market conditions the return on bonds is also asymmetric, meaning the gain after a 1.0% decrease in rates would be higher than the loss after a 1.0% increase in rates. This is especially true for long term fixed income investments as they are inherently more sensitive to interest rate changes. Futures markets are still predicting that short term rates have peaked at the Fed’s 5.25% to 5.50% target with the probability of a rate increase the highest in January at 40%.
Commodities
The Israel-Hamas conflict continues to cause increased volatility in oil prices with the World Bank now warning that prices could reach as high as $150 a barrel if the conflict intensifies in a repeat of the 1970’s supply shock. However, this should only be considered a worst-case scenario as the middle east is currently responsible for a much smaller percentage of global oil exports compared to that period. Current predictions are that overall commodity prices will fall around 4% in the next year with oil remaining around $82 a barrel. Natural gas prices increased slightly last week reversing the drop in prices from the week before as temperatures continue to fall. Gold and Silver prices remained steady following the mild rally in precious metals that began early this month.
Interesting Articles
Market Update: October 16 - 20, 2023

Weekly Summary
Last week inflation data for several major countries released at or below expectations, painting an optimistic picture that price levels are continuing to stabilize globally. This Friday US Core PCE, the measure of inflation most closely watched by the Federal Reserve, is set to release while the Fed will make its next interest rate decision the following Wednesday. Long-term rates rose sharply last week, providing investors with an opportunity to lock in higher-than-normal yields and causing equity markets to struggle to compete with fixed income markets. Uncertainty surrounding the conflict between Israel and Hamas caused increased volatility in oil prices and continued to put upward pressure on precious metals like gold and silver.
Economic Data
Last Monday inflation in Canada released at 3.8%, under the forecast of 4.0%. US retail sales grew by 0.7% in the month of September, higher than the expected 0.3% in a sign that the economy remains resilient despite rising rates. Chinese GDP also grew more than expected at 4.9% annually versus the forecasted 4.4%. On Tuesday core inflation in the UK released at 6.1% below the expected 6.6%, while core inflation in the Euro Area was as expected at 4.5%. Finally, on Thursday Federal Reserve Chair Jerome Powell gave a speech at the Economic Club of New York Luncheon and spoke positively about the current direction of inflation, the labor market, and economic growth. However, he remained consistent with the Fed’s previous position that further tightening may still be necessary as long as core PCE remains above 3.0%. August’s core PCE inflation reading was 3.9% and September’s reading is set to release Friday morning.
Equities
Equity markets struggled to compete with rising fixed income rates last week with the S&P-500 falling about 2.4% and the NASDAQ-100 falling about 2.6%. Despite this the S&P-500 has still performed above average this year and is up about 9.7% from the lows reached in March following the regional banking crisis. In other positive news the VIX, a measure of volatility in the S&P-500, fell from a seven-month high on Monday morning. The VIX is often referred to as the market’s “fear index” or “fear gauge” as it tends to increase during times of uncertainty and decrease during bull runs in equity markets. Only about one fifth of S&P-500 companies have reported earnings for last quarter so far and earnings for several major companies including Microsoft, Alphabet, Meta, Intel, and Amazon will release later this week.
Fixed Income
Interest rates were more volatile than normal last week with further large moves in the long end of the yield curve. Yields on 10- and 30-year treasuries increased by roughly 0.3% with the 30-year yielding over 5.1% Monday morning. 30-year treasuries are now yielding more than their 2-year equivalent, another step in the yield curve reversing from its currently inverted state. An inverted yield curve has historically been a predictor of a coming recession, so this reversal is a positive sign for the overall state of the economy. Expectations of a rate increase at the November 1stFed meeting dropped last week with there now being a 98.5% prediction of no rate increase and a 1.5% prediction of rates falling. Futures markets continue to imply that peak rates have already been reached although there is still a roughly 35% prediction of one more rate increase before the end of this cycle.
Commodities
Oil prices rose slightly last week though the current price of about $87.00 a barrel is still below the highs of over $93.00 reached in late September. Price increases earlier this year were mostly the result of reduced supply from OPEC and ongoing Russian sanctions, but the more recent short-term increases are correlated with increasing uncertainty surrounding the conflict between Israel and Hamas. While this region of the Middle East is not a large supplier of oil, an escalation to a larger conflict involving countries like Iran, Egypt, and Syria has the potential to disrupt key trading routes such as the strait of Hormuz. Natural gas prices fell slightly as worldwide production hit an all-time high and weather throughout October was milder than expected. Both gold and silver continued to follow the upward trend that began following Hamas’ attack in southern Israel.
Interesting Articles
Market Update: October 9 - 13, 2023

Weekly Summary
Several key measures of inflation released last week at close to expected levels, leading to strong performance in both the equity and fixed income markets. A shifted tone in messaging by the Federal Reserve has increased expectations that peak interest rates have already been reached and caused long term Treasury rates to drop for the first time in several weeks. The tightening of sanctions on Russian oil exports along with concerns over geopolitical stability in the Middle East caused oil prices to rise slightly in the second half of last week after falling from the high reached in late September. The same geopolitical tensions caused a flight to safety among some investors and led to a strong performance by precious metals last week.
Economic Data
On Wednesday the Producer Price Index measure of US inflation released at 2.2% year over year, above the consensus estimate of 1.6% but only slightly higher than last month’s reading of 2.0%. The following day the Consumer Price Index measure of inflation released at 3.7% year over year, matching last month’s reading and again only slightly higher than the consensus estimate. Core CPI inflation, which excludes more volatile food and energy prices, released at the expected 4.1% year over year and fell slightly from last month’s reading of 4.3%. The largest contributor to consumer inflation was the rising cost of shelter, which accounted for over half of the increase in prices this month. Rising oil prices were also a major contributor in September though we can expect to see a much smaller impact in next month’s readings as oil prices have fallen after reaching a one year high at the end of September. Inflation measures for the UK, Euro Area, Canada, Australia, and Japan will be releasing later this week.
Equities
Equity markets performed fairly well last week with the S&P 500 now up over 0.9% from its open last Monday and the NASDAQ-100 up almost 0.8% over the same period. Several Federal Reserve officials spoke publicly last week and there appears to be a slow shift in tone regarding the central bank’s messaging. Discussion among Fed members seems to be transitioning away from whether further rate hikes will be needed and towards how long restrictive rates will need to be maintained next year. Companies with high exposure to the defense contracting industry performed especially well early last week out of fear that tensions between Israel and Hamas may continue to increase.
Fixed Income
Long term rates fell last week after several weeks of rate increases beginning at the end of August. Mild inflation releases continue to increase expectations that peak short-term interest rates have already been reached, or will be reached no later than January of next year. Markets are currently only predicting a 7.3% chance of a rate increase at the Federal Reserve’s November 1st meeting, down from 19.6% last week and 27.2% the week before. The next major events to affect fixed income markets will be the European Central Bank’s interest rate decision on Thursday, October 26th and the Personal Consumption Expenditure measure of US inflation releasing the following day.
Commodities
Oil prices were mostly flat early last week trading in the $83-$85 per barrel range after falling from a one year high of over $94 earlier this month. Prices rose slightly on Friday after the United States tightened G7 sanctions on Russian oil sold through Turkey and the United Arab Emirates. The ongoing conflict between Israel and Hamas has yet to have any significant effect on energy prices as Israel is not a major oil producer, but there is concern that potential involvement by Iran or Saudi Arabia could eventually have an impact on global crude supply. Natural gas continues to slowly rise as the winter approaches and colder weather begins to set in. Gold performed extremely well last week and is currently up over 4.1% from last Monday following the escalation in conflict between Hamas and Israeli troops. Silver followed a similar pattern and is up over 4.4% over the same period.
Interesting Articles
Market Update: October 2 - 6, 2023

Weekly Summary
Last week the Institute for Supply Management released their Report on Business which showed that the US service economy is expanding while the manufacturing economy is retracting slightly. US and Canadian unemployment data showed the amount of new jobs added was much higher than expected in both countries. This week the CPI and PPI measures of inflation are set to release which will likely have a large impact on the November 1st Fed meeting. Energy prices may be more volatile than normal due to the possibility of countries passing sanctions on Iran for assisting in Hamas’ recent attack on Israel.
Economic Data
The Institute for Supply Management released their September Report on Business, containing the Purchasing Manager’s Index for both manufacturing and services. Manufacturing released at 49, slightly above the forecast of 47.8, while services released at the forecast of 53.6. A PMI reading of above 50 indicates that the sector of the economy is expanding overall, while a reading below 50 shows a contraction. On Friday employment change and unemployment rates for both the US and Canada were released. The US added 336k new jobs in September, over twice as many as expected, while Canada added 63.8k jobs, over three times as many as expected. Canadian unemployment was slightly below the expected 5.6% at 5.5%, while the US was slightly higher than the expected 3.7% at 3.8%. This Wednesday the Producer Price Index measure of inflation is set to release with the Consumer Price Index measure set to release the following day.
Equities
Equity markets started the week slow with the S&P-500 down 1.4% on mid-day Wednesday. The release of a strong ISM Services PMI appeared to reverse the trend and the S&P-500 is now up 0.5% from last Monday’s closing price. The tech heavy NASDAQ-100 performed well over the same period and finished the week up 1.6%, while the manufacturing heavy Dow Jones Industrial Average was up only 0.2%. Overall, more risky stocks such as tech and mid-caps performed well following Friday’s employment release while small-caps and value stocks struggled to keep up.
Fixed Income
The yield curve rose across the board last week though the changes were significant at the long end of the curve. Rates one year or shorter continue to fluctuate in the 5.4-5.7% range while the 30 year is now almost above 5.0%. The probability of a rate increase at the November 1st Federal Reserve meeting increased from 14.3% to 27.2% following the strong jobs report on Friday, but has now fallen back down to 19.6% as of Monday. This week the fixed income markets will be most concerned with the inflation data releasing Wednesday and Thursday which are likely to have a large impact on whether the Federal Reserve decides to hold rates steady or hike one more time before the end of the year.
Commodities
Oil prices fell slightly last week before opening several dollars up this Monday following the invasion of Israel. Natural Gas also rose in price as colder weather approaches and is now over $3.00. Gold was flat for most of the week before rising over a full percent this Monday alone. Silver also performed well last week gaining 4.0%.
Interesting Articles
- Yahoo Finance: JOBS REPORT STUNNER: US economy creates 336,000 jobs in September, nearly twice the number expected
- Moneywise: America is now paying more in interest on its record $33 trillion debt than on national defense — here's who holds the IOUs
- Morningstar: Should You Delay Taking Social Security Benefits?
Market Update: September 25 - 29, 2023

Weekly Summary
Inflation in Germany, France, and the general Eurozone all released at below expectations last week, which is good news for the continent’s central bank. Congress was able to pass a last-minute spending bill over the weekend, avoiding a government shutdown but still has only until November 17th to pass a budget and avoid another potential shutdown. The US PCE measure of inflation and the final Q2 GDP reading both released at expected levels, making the Federal Reserve’s rate decision at the end of the month more complicated. Interest rates continued to rise and oil is now at its highest price in nearly a year, while natural gas is at its highest price since March.
Economic Data
German inflation data released on Saturday at 4.5%, slightly below expectations of 4.6% and was good news for the economic center of the European Union. The rise in German unemployment also came in at only 10,000 citizens versus the expected 15,000. US Q2 GDP released the same day and grew at the forecasted 2.1% in the second quarter. Both the French and Eurozone in general had inflation come in slightly below expectations at 4.8% and 4.9%. The US Personal Consumption Expenditures measure of inflation released on Friday at the expected 3.5%, while core CPE excluding food and energy was at the expected 3.9%.
Equities
The equity markets started the week down with the S&P 500 losing 1.5%. The market rallied on Thursday after the release of US GDP figures but reversed some of these gains on Friday, ending the week down 1.1%. The NASDAQ-100 was mostly flat ending the week down 0.4% but has since recovered and is up slightly under 0.1%. Despite the strong GDP and inflation readings September was the S&P’s worst month this year, even with the Federal Reserve’s decision to not raise interest rates. However, the S&P is still up 11.6% since January and is slowly approaching the all-time high reached at the end of 2021. The potential government shutdown was unlikely to have a large effect on equity markets but could have delayed the release of economic data closely watched by the Federal Reserve such as the unemployment release this Friday. Congress now has until November 17 to pass another bill to avoid a shutdown.
Fixed Income
The long end of the yield curve rose again last week as the ten-year reached a rate of 4.6% while the 30-year passed 4.7%. Predictions of a rate increase at the November meeting rose from 18.4% to 30.9% after the release of US GDP growth on Thursday. The probability of another hike still peaks at the January meeting at 46.2% and cuts are currently not expected until at least July. As rates continue to rise Treasuries are now on track to post their third annual loss in a row for the first time in US history. The unemployment rate releasing this Friday is likely to have a large impact on November’s Fed meeting and the Fed’s action throughout the rest of the fourth quarter.
Commodities
For the second week in a row oil rose to above $93, prices previously not reached since last November. As of Monday, oil has fallen to below $89 a barrel. The price of natural gas also rose sharply from $2.64 to nearly $2.93 with forecasts of cooler months coming up which would increase demand for heating. Gold fell over 3.6% last week after the release of mild PCE inflation and strong manufacturing data released from the Purchasing Manager’s Index. Silver was also hit hard, losing over 5.8% in the last week alone.
Interesting Articles
- BBC: Why government shutdowns seem to only happen in US
- Bloomberg: US Core PCE Prices Post Smallest Monthly Rise Since Late 2020
- Wall Street Journal: Americans Finally Start to Feel the Sting From the Fed’s Rate Hikes
All data and figures in this article were collected from YCharts, Inc. on 10/2/2023 by Zach Hill of Blue Ridge Wealth Planners unless otherwise cited.
This report was prepared by Blue Ridge Wealth Planners, a federally registered investment adviser under the Investment Advisers Act of 1940. Registration as an investment adviser does not imply a certain level of skill or training.
All information is strictly as of the date indicated and does not reflect positioning or characteristics averaged over any period. All information referenced is for strictly information purposes only, and this piece should not be construed as a recommendation to purchase or sell the security referenced. Investing in any security, including the securities presented in this presentation, involves the potential loss of principal, and past performance it not necessarily indicative of future results.
Market Update: September 18 - 22, 2023

Weekly Summary
The Federal Reserve met this week and announced a decision to keep rates steady as expected. However, their insistence on keeping another rate hike on the table as well as signals of a plan to keep rates high for longer caused equity markets to slide. Inflation throughout Europe finally appears to be beginning to moderate and oil prices seem to finally be stabilizing around $90 a barrel, giving some relief to consumers after a steady rise in prices over the past month. Heading into this week markets will be watching for the release of the US Personal Consumption Expenditures measure of inflation this Friday and to see if Congress is able to pass a new spending bill by Saturday to avoid a government shutdown.
Economic Data
Several inflation measures for foreign countries released last week. On Tuesday, Euro Area core inflation released at the expected 5.3% annually, while Canadian headline inflation was slightly above the expected 3.8% at 4.0%. In more positive news core inflation in the UK was significantly below expectations at 6.2% versus a forecasted 6.8%. Headline UK inflation also released at 6.7%, below the expected 7%. This week we will receive more inflation data from Germany and France, as well as the PCE measure of US inflation. We will also learn the final US GDP growth rate for this year’s second quarter which will shed further insight into the state of the economy.
Equities
The equity markets reacted negatively to the Federal Reserve’s comments with the S&P 500 falling 2.9% on Wednesday and Thursday. The NASDAQ-100 fell an even further 3.2% over the same period with some investors transitioning from growth heavy tech companies into more stable value investments. Equity markets have seen little growth since July after a rally through the first half of this year. Though September has been a weak month for equity markets, indexes like the S&P 500 are still up over 13% since January.
Fixed Income
The long end of the yield curve moved up slightly last week and the curve continues to slowly inch out of its inverted state. The largest topic discussion this week was the Federal Reserve meeting that concluded Wednesday. As expected, Fed officials decided to keep interest rates steady at this meeting but maintained the position that further hikes may still be coming this year. They also pushed back expectations of eventual cuts until June 2024, signaling they are willing to keep rates high for longer than previously expected. The Bank of England also decided to keep rates steady, a move that was less expected as the UK and the rest of Europe continue to struggle with higher inflation than the US.
Commodities
Oil prices reached their highest point so far this year on Monday surpassing $95 a barrel at one point. However, prices dropped slightly throughout the rest of the week and now appear to be stabilizing around $90 a barrel. Natural gas prices continue to hover in the $2.50 to $2.70 range but can be expected to slowly increase as temperatures begin to moderate and demand rises. Gold rose following the Fed’s re-stated commitment to keep rates higher for longer, but by Friday afternoon was trading back at the previous week’s levels. The price of silver fell slightly throughout the week but is still up over 1% for the month.
Interesting Articles
- PBS: The government is headed for a shutdown. Who’s affected and what happens next?
- Wall Street Journal: Higher Interest Rates Not Just for Longer, but Maybe Forever
- Financial Times: Western companies take slow steps towards China ‘de-risking’
All data and figures in this article were collected from YCharts, Inc. on 09/25/2023 by Zach Hill of Blue Ridge Wealth Planners unless otherwise cited.
This material represents an assessment of the market and economic environment at a specific point in time and is not intended to be a forecast of future events, or a guarantee of future results. Forward-looking statements are subject to certain risks and uncertainties. Actual results, performance, or achievements may differ materially from those expressed or implied. Information is based on data gathered from what we believe are reliable sources. It is not guaranteed as to accuracy, does not purport to be complete and is not intended to be used as a primary basis for investment decisions. It should also not be construed as advice meeting the particular investment needs of any investor. Past performance does not guarantee future results.
Investments in emerging markets may be more volatile and less liquid than investing in developed markets and may involve exposure to economic structures that are generally less diverse and mature and to political systems which have less stability than those of more developed countries.
Investments in commodities may have greater volatility than investments in traditional securities, particularly if the instruments involve leverage. The value of commodity-linked derivative instruments may be affected by changes in overall market movements, commodity index volatility, changes in interest rates or factors affecting a particular industry or commodity, such as drought, floods, weather, livestock disease, embargoes, tariffs and international economic, political and regulatory developments. Use of leveraged commodity-linked derivatives creates an opportunity for increased return but, at the same time, creates the possibility for greater loss.
An index is an unmanaged portfolio of specific securities, the performance of which is often used as a benchmark in judging the relative performance of certain asset classes. Investors cannot invest directly in an index. An index does not charge management fees or brokerage expenses, and no such fees or expenses were deducted from the performance shown.
The Standard & Poor's 500 (S&P 500) is an unmanaged group of securities considered to be representative of the stock market in general. It is a market value weighted index with each stock's weight in the index proportionate to its market value.
The Financial Times Stock Exchange 100 Index, also called the FTSE 100 Index, FTSE 100, FTSE, or, informally, the "Footsie" is a share index of the 100 companies listed on the London Stock Exchange with the highest market capitalization. It is seen as a gauge of prosperity for businesses regulated by UK company law.
The FTSE Developed Europe Index is an index of European stocks, part of the FTSE Global Equity Index Series. It is a subset of the FTSE Europe Index. The FTSE Eurobloc Index is a subset of it.
The MSCI Emerging Markets Index is a float-adjusted market capitalization index that consists of indices in 21 emerging economies: Brazil, Chile, China, Colombia, Czech Republic, Egypt, Hungary, India, Indonesia, Korea, Malaysia, Mexico, Morocco, Peru, Philippines, Poland, Russia, South Africa, Taiwan, Thailand, and Turkey.
The Bloomberg Barclays US Aggregate Bond Index, or the Agg, is a broad base, market capitalization-weighted bond market index representing intermediate term investment grade bonds traded in the United States. Investors frequently use the index as a stand-in for measuring the performance of the US bond market.
The US Dollar Index (USDX, DXY) is an index (or measure) of the value of the United States dollar relative to a basket of foreign currencies, often referred to as a basket of US trade partners' currencies.
The Consumer Price Index (CPI) is a measure of inflation compiled by the US Bureau of Labor Studies.
West Texas Intermediate (WTI), also known as Texas light sweet, is a grade of crude oil used as a benchmark in oil pricing. This grade is described as light because of its relatively low density, and sweet because of its low sulfur content.
The Producer Price Index (PPI) is a family of indexes that measures the average change over time in selling prices received by domestic producers of goods and services. PPIs measure price change from the perspective of the seller.
This report was prepared by Blue Ridge Wealth Planners, a federally registered investment adviser under the Investment Advisers Act of 1940. Registration as an investment adviser does not imply a certain level of skill or training. The oral and written communications of an adviser provide you with information about which you determine to hire or retain an adviser. Blue Ridge Wealth Planners Form ADV Part 2A & 2B can be obtained by going to www.adviserinfo.sec.gov. and searching the firms name. Neither the information nor any opinion expressed it so be construed as solicitation to buy or sell a security of personalized investment, tax, or legal advice.
Market Update: September 11 - 15, 2023

Weekly Summary
There was little movement in either the equity or fixed income markets last week despite key inflation metrics releasing slightly higher than expected. However, much of the rise appears to be due to the rising price of oil as demand increases in China. The Federal Reserve is set to meet this week and will decide whether to increase interest rates. Markets currently do not expect rates to increase at this meeting, so discussion will likely center mostly on the economic outlook for the rest of the year.
Economic Data
Both the Consumer Price Index and Producer Price Index measures of inflation released this week. CPI was only slightly higher than expected at 3.07% annually versus 3.6%. However, core CPI, which excludes food and energy costs, released as expected at 4.3%. PPI was also slightly higher the expected at 1.6%. Core PPI released at the expected 2.1%, the lowest annual level since January 2021. Most of the increase in both measures of inflation was due to rising energy prices as oil continues to climb higher.
Equities
Markets reacted surprisingly well to slightly above inflation readings with the S&P 500 rising 0.39% on Thursday. However, all gains in the index were reversed on Friday with the index reverting to the previous week’s levels. The S&P 500 is still up over 2% in the last month and over 16.5% since the start of the year. Chipmaker Arm Holdings had an initial public offering and surpassed price expectations over excitement about the company’s participation in the booming AI industry. Private equity company Blackstone as well as Airbnb joined the S&P 500 on Monday.
Fixed Income
US Treasury rates were again largely unchanged last week although long term rates did rise very slightly. The Federal Reserve is set to meet this week and futures markets are predicting only a 1% probability of a rate increase, down from 3% last week. Market consensus appears to be that peak interest rates have already been reached, though there’s still about a 40% probability of one more increase by December. The European Central Bank raised interest rate targets by 0.25% to 4.5% in an effort to fight ongoing inflation in the Eurozone.
Commodities
Increased Chinese demand along with export restrictions by OPEC have continued to put upward pressure on the price of oil. WTI crude oil futures prices have risen to over $90 dollars a barrel for the first time since November 2022. Natural gas prices have hovered around $2.50 for the past several months and are not expected to increase until the winter season. The price of gold and silver rose slightly after a gradual decline that began at the end of August.
Interesting Articles
- Yahoo Finance: 'An economic divide that is widening': Almost a third of Americans earning $150,000 a year or more say they're living paycheck to paycheck and many rely on credit cards to close the gap
- Wall Street Journal: Why a Soft Landing Could Prove Elusive
- CNBC: Major central banks are on the brink of peak rates — but the inflation battle might not be over
All data and figures in this article were collected from YCharts, Inc. on 09/18/2023 by Zach Hill of Blue Ridge Wealth Planners unless otherwise cited.
This material represents an assessment of the market and economic environment at a specific point in time and is not intended to be a forecast of future events, or a guarantee of future results. Forward-looking statements are subject to certain risks and uncertainties. Actual results, performance, or achievements may differ materially from those expressed or implied. Information is based on data gathered from what we believe are reliable sources. It is not guaranteed as to accuracy, does not purport to be complete and is not intended to be used as a primary basis for investment decisions. It should also not be construed as advice meeting the particular investment needs of any investor. Past performance does not guarantee future results.
Investments in emerging markets may be more volatile and less liquid than investing in developed markets and may involve exposure to economic structures that are generally less diverse and mature and to political systems which have less stability than those of more developed countries.
Investments in commodities may have greater volatility than investments in traditional securities, particularly if the instruments involve leverage. The value of commodity-linked derivative instruments may be affected by changes in overall market movements, commodity index volatility, changes in interest rates or factors affecting a particular industry or commodity, such as drought, floods, weather, livestock disease, embargoes, tariffs and international economic, political and regulatory developments. Use of leveraged commodity-linked derivatives creates an opportunity for increased return but, at the same time, creates the possibility for greater loss.
An index is an unmanaged portfolio of specific securities, the performance of which is often used as a benchmark in judging the relative performance of certain asset classes. Investors cannot invest directly in an index. An index does not charge management fees or brokerage expenses, and no such fees or expenses were deducted from the performance shown.
The Standard & Poor's 500 (S&P 500) is an unmanaged group of securities considered to be representative of the stock market in general. It is a market value weighted index with each stock's weight in the index proportionate to its market value.
The Financial Times Stock Exchange 100 Index, also called the FTSE 100 Index, FTSE 100, FTSE, or, informally, the "Footsie" is a share index of the 100 companies listed on the London Stock Exchange with the highest market capitalization. It is seen as a gauge of prosperity for businesses regulated by UK company law.
The FTSE Developed Europe Index is an index of European stocks, part of the FTSE Global Equity Index Series. It is a subset of the FTSE Europe Index. The FTSE Eurobloc Index is a subset of it.
The MSCI Emerging Markets Index is a float-adjusted market capitalization index that consists of indices in 21 emerging economies: Brazil, Chile, China, Colombia, Czech Republic, Egypt, Hungary, India, Indonesia, Korea, Malaysia, Mexico, Morocco, Peru, Philippines, Poland, Russia, South Africa, Taiwan, Thailand, and Turkey.
The Bloomberg Barclays US Aggregate Bond Index, or the Agg, is a broad base, market capitalization-weighted bond market index representing intermediate term investment grade bonds traded in the United States. Investors frequently use the index as a stand-in for measuring the performance of the US bond market.
The US Dollar Index (USDX, DXY) is an index (or measure) of the value of the United States dollar relative to a basket of foreign currencies, often referred to as a basket of US trade partners' currencies.
The Consumer Price Index (CPI) is a measure of inflation compiled by the US Bureau of Labor Studies.
West Texas Intermediate (WTI), also known as Texas light sweet, is a grade of crude oil used as a benchmark in oil pricing. This grade is described as light because of its relatively low density, and sweet because of its low sulfur content.
The Producer Price Index (PPI) is a family of indexes that measures the average change over time in selling prices received by domestic producers of goods and services. PPIs measure price change from the perspective of the seller.
This report was prepared by Blue Ridge Wealth Planners, a federally registered investment adviser under the Investment Advisers Act of 1940. Registration as an investment adviser does not imply a certain level of skill or training. The oral and written communications of an adviser provide you with information about which you determine to hire or retain an adviser. Blue Ridge Wealth Planners Form ADV Part 2A & 2B can be obtained by going to www.adviserinfo.sec.gov. and searching the firms name. Neither the information nor any opinion expressed it so be construed as solicitation to buy or sell a security of personalized investment, tax, or legal advice.
Market Update: September 4 - 8, 2023

Weekly Summary
US markets fell slightly after being closed Monday for Labor Day but have now mostly recovered due to several strong performers in the tech industry. Discussion this week is likely to center mostly around the CPI and PPI measures of inflation releasing Wednesday and Thursday respectively. Fixed income markets were little changed though may become more volatile surrounding the Federal Reserve meeting later this month. The price of oil rose after Saudi Arabia reaffirmed their commitment to restricting exports.
Economic Data
Few economic indicators released last week. Quarterly GDP growth in the Euro area was lower than expected at -0.1% versus 0.3%. Annual GDP growth in Japan was also lower than expected but still strong at 4.8%. Inflation in Germany is still high coming in at the expected 6.1%. Several economic indicators are set to release this week with the consumer price index, a key measure of inflation, releasing Wednesday. The producer price index, a measure of inflation for US businesses rather than consumers, will release the following day.
Equities
The US equity market had a mixed week after being closed on Monday for Labor Day. The S&P 500 fell about 1%, but as of Monday the index has recovered some losses and is now down only about 0.5%. The Nasdaq-100 fared slightly better and is now flat for the week. Apple is set to unveil the iPhone 15 on Tuesday of this week and recently announced the extension of a deal with semiconductor manufacturer Qualcomm. This Monday Morgan Stanley massively upgraded their price target for Tesla causing the electronic car manufacturer’s stock price to increase over 10%.
Fixed Income
US treasury rates changed little last week though may become more volatile as the Federal Research meeting on September 20th approaches. Futures markets are predicting only a 3% chance of a rate increase at the next meeting, but a much higher 46% chance of a rate increase by December. Speculation over the current state of regional and local banks has driven the price of commercial bonds slightly lower due to these banks heavy exposure to debt relating to commercial real estate.
Commodities
Oil prices continue to rise as Saudi Arabia has maintained a commitment to restrict exports. Iran and Russia have also maintained restrictions although they are currently forced to sell mainly to China due to foreign sanctions. Natural gas prices continue to fall as the more mild-weather fall season begins. Gold prices also fell as demand continues to decrease for the inflation hedge. The price of silver followed the same pattern after strong performance the previous week.
Interesting Articles
- CNBC: Tesla shares soar 10% after Morgan Stanley upgrade
- Bloomberg: The Mighty American Consumer Is About to Hit a Wall, Investors Say
- Wall Street Journal: Real-Estate Doom Loop Threatens America’s Banks
All data and figures in this article were collected from YCharts, Inc. on 09/11/2023 by Zach Hill of Blue Ridge Wealth Planners unless otherwise cited.
This material represents an assessment of the market and economic environment at a specific point in time and is not intended to be a forecast of future events, or a guarantee of future results. Forward-looking statements are subject to certain risks and uncertainties. Actual results, performance, or achievements may differ materially from those expressed or implied. Information is based on data gathered from what we believe are reliable sources. It is not guaranteed as to accuracy, does not purport to be complete and is not intended to be used as a primary basis for investment decisions. It should also not be construed as advice meeting the particular investment needs of any investor. Past performance does not guarantee future results.
Investments in emerging markets may be more volatile and less liquid than investing in developed markets and may involve exposure to economic structures that are generally less diverse and mature and to political systems which have less stability than those of more developed countries.
Investments in commodities may have greater volatility than investments in traditional securities, particularly if the instruments involve leverage. The value of commodity-linked derivative instruments may be affected by changes in overall market movements, commodity index volatility, changes in interest rates or factors affecting a particular industry or commodity, such as drought, floods, weather, livestock disease, embargoes, tariffs and international economic, political and regulatory developments. Use of leveraged commodity-linked derivatives creates an opportunity for increased return but, at the same time, creates the possibility for greater loss.
An index is an unmanaged portfolio of specific securities, the performance of which is often used as a benchmark in judging the relative performance of certain asset classes. Investors cannot invest directly in an index. An index does not charge management fees or brokerage expenses, and no such fees or expenses were deducted from the performance shown.
The Standard & Poor's 500 (S&P 500) is an unmanaged group of securities considered to be representative of the stock market in general. It is a market value weighted index with each stock's weight in the index proportionate to its market value.
The Financial Times Stock Exchange 100 Index, also called the FTSE 100 Index, FTSE 100, FTSE, or, informally, the "Footsie" is a share index of the 100 companies listed on the London Stock Exchange with the highest market capitalization. It is seen as a gauge of prosperity for businesses regulated by UK company law.
The FTSE Developed Europe Index is an index of European stocks, part of the FTSE Global Equity Index Series. It is a subset of the FTSE Europe Index. The FTSE Eurobloc Index is a subset of it.
The MSCI Emerging Markets Index is a float-adjusted market capitalization index that consists of indices in 21 emerging economies: Brazil, Chile, China, Colombia, Czech Republic, Egypt, Hungary, India, Indonesia, Korea, Malaysia, Mexico, Morocco, Peru, Philippines, Poland, Russia, South Africa, Taiwan, Thailand, and Turkey.
The Bloomberg Barclays US Aggregate Bond Index, or the Agg, is a broad base, market capitalization-weighted bond market index representing intermediate term investment grade bonds traded in the United States. Investors frequently use the index as a stand-in for measuring the performance of the US bond market.
The US Dollar Index (USDX, DXY) is an index (or measure) of the value of the United States dollar relative to a basket of foreign currencies, often referred to as a basket of US trade partners' currencies.
The Consumer Price Index (CPI) is a measure of inflation compiled by the US Bureau of Labor Studies.
West Texas Intermediate (WTI), also known as Texas light sweet, is a grade of crude oil used as a benchmark in oil pricing. This grade is described as light because of its relatively low density, and sweet because of its low sulfur content.
The Producer Price Index (PPI) is a family of indexes that measures the average change over time in selling prices received by domestic producers of goods and services. PPIs measure price change from the perspective of the seller.
This report was prepared by Blue Ridge Wealth Planners, a federally registered investment adviser under the Investment Advisers Act of 1940. Registration as an investment adviser does not imply a certain level of skill or training. The oral and written communications of an adviser provide you with information about which you determine to hire or retain an adviser. Blue Ridge Wealth Planners Form ADV Part 2A & 2B can be obtained by going to www.adviserinfo.sec.gov. and searching the firms name. Neither the information nor any opinion expressed it so be construed as solicitation to buy or sell a security of personalized investment, tax, or legal advice.
Market Update: August 28 - September 1, 2023

Weekly Summary
Economic indicators released this week painted the impression that the US economy is still fairly strong, but slowing down quicker than expected. US Equity and Fixed Income markets were closed Monday during Labor Day which likely contributed to a slightly less volatile week than normal. This is a common occurrence surrounding some bank holidays like Labor Day because of increased vacation and travel. Emerging markets were impacted by both the potential default on debt from a major Chinese real estate developer and strong economic growth in India. Oil prices continue to slowly rise due to OPEC’s commitment to restrict supply.
Economic Data
Several major US economic indicators released this week. On Tuesday, second quarter GDP growth came in at 2.1% versus the expected 2.4%, but ahead of the first quarter’s growth of 2.0%. While the economy is still strong this is a potential sign it’s cooling down slightly faster than economists previously expected. The Personal Consumption Expenditure Price Index measure of inflation released at the expected 3.3%. Core PCE, which excludes food and energy prices, also released at the expected 4.2%. Unemployment was slightly higher than expected at 3.8% versus the predicted 3.5%. All these indicators were neutral or negative but contributed to a mild market rally because of an expectation that the Federal Reserve will now have a more difficult time justifying further rate hikes.
Equities
US Equity markets had another strong start this week with an over 1.5% gain in the S&P 500 on Monday alone. Equity markets were fairly flat through the rest of the week with only a mild decrease Friday. This is a common occurrence around bank holidays like Labor Day because market volume tends to significantly decrease with many people traveling or on vacation. Emerging markets struggled partially due to fears that Country Garden, one of China’s largest property developers, would not be able to afford previously delayed interest payments on foreign issued bonds. The company has now succeeded in making interest payments on these bonds and emerging markets have recovered, assisted by strong GDP growth in India.
Fixed Income
US rates were again largely unchanged this week but dropped very slightly after inflation data released. Investors have become more optimistic that peak interest rates have already been reached with futures markets predicting only a 5% chance of a rate increase at the next Fed meeting later this month and a 39% chance of one before the end of the year. Rate decreases are now predicted as early as the May 2024 meeting. GDP growth was slightly below forecast in Mexico at 3.6% and significantly below forecast in Canada at -0.2%. Reduced foreign trade is unlikely to benefit the US economy overall but could play a part in helping bring inflation down.
Commodities
OPEC continues to restrict supplies, pushing oil prices to their highest point in 2023 although they still remain close to the long-term average. Natural gas prices were essentially flat despite several countries still enforcing sanctions on Russia due to the ongoing war in Ukraine. Russia is currently the second largest supplier of liquified natural gas to Europe, behind only the US. The price of gold increased very slightly, counteracted by a mild decrease in the price of silver. Despite this both commodities remain above their one-year average.
Interesting Articles
- CNBC: Saudi Arabia to extend voluntary cut of 1 million barrels per day until the end of the year
- Financial Times: EU imports record volumes of liquefied natural gas from Russia
- Wall Street Journal: The Cheap Flights of Fall Are Back
All data and figures in this article were collected from YCharts, Inc. on 09/05/2023 by Zach Hill of Blue Ridge Wealth Planners unless otherwise cited.
This material represents an assessment of the market and economic environment at a specific point in time and is not intended to be a forecast of future events, or a guarantee of future results. Forward-looking statements are subject to certain risks and uncertainties. Actual results, performance, or achievements may differ materially from those expressed or implied. Information is based on data gathered from what we believe are reliable sources. It is not guaranteed as to accuracy, does not purport to be complete and is not intended to be used as a primary basis for investment decisions. It should also not be construed as advice meeting the particular investment needs of any investor. Past performance does not guarantee future results.
Investments in emerging markets may be more volatile and less liquid than investing in developed markets and may involve exposure to economic structures that are generally less diverse and mature and to political systems which have less stability than those of more developed countries.
Investments in commodities may have greater volatility than investments in traditional securities, particularly if the instruments involve leverage. The value of commodity-linked derivative instruments may be affected by changes in overall market movements, commodity index volatility, changes in interest rates or factors affecting a particular industry or commodity, such as drought, floods, weather, livestock disease, embargoes, tariffs and international economic, political and regulatory developments. Use of leveraged commodity-linked derivatives creates an opportunity for increased return but, at the same time, creates the possibility for greater loss.
An index is an unmanaged portfolio of specific securities, the performance of which is often used as a benchmark in judging the relative performance of certain asset classes. Investors cannot invest directly in an index. An index does not charge management fees or brokerage expenses, and no such fees or expenses were deducted from the performance shown.
The Standard & Poor's 500 (S&P 500) is an unmanaged group of securities considered to be representative of the stock market in general. It is a market value weighted index with each stock's weight in the index proportionate to its market value.
The Financial Times Stock Exchange 100 Index, also called the FTSE 100 Index, FTSE 100, FTSE, or, informally, the "Footsie" is a share index of the 100 companies listed on the London Stock Exchange with the highest market capitalization. It is seen as a gauge of prosperity for businesses regulated by UK company law.
The FTSE Developed Europe Index is an index of European stocks, part of the FTSE Global Equity Index Series. It is a subset of the FTSE Europe Index. The FTSE Eurobloc Index is a subset of it.
The MSCI Emerging Markets Index is a float-adjusted market capitalization index that consists of indices in 21 emerging economies: Brazil, Chile, China, Colombia, Czech Republic, Egypt, Hungary, India, Indonesia, Korea, Malaysia, Mexico, Morocco, Peru, Philippines, Poland, Russia, South Africa, Taiwan, Thailand, and Turkey.
The Bloomberg Barclays US Aggregate Bond Index, or the Agg, is a broad base, market capitalization-weighted bond market index representing intermediate term investment grade bonds traded in the United States. Investors frequently use the index as a stand-in for measuring the performance of the US bond market.
The US Dollar Index (USDX, DXY) is an index (or measure) of the value of the United States dollar relative to a basket of foreign currencies, often referred to as a basket of US trade partners' currencies.
The Consumer Price Index (CPI) is a measure of inflation compiled by the US Bureau of Labor Studies.
West Texas Intermediate (WTI), also known as Texas light sweet, is a grade of crude oil used as a benchmark in oil pricing. This grade is described as light because of its relatively low density, and sweet because of its low sulfur content.
The Producer Price Index (PPI) is a family of indexes that measures the average change over time in selling prices received by domestic producers of goods and services. PPIs measure price change from the perspective of the seller.
This report was prepared by Blue Ridge Wealth Planners, a federally registered investment adviser under the Investment Advisers Act of 1940. Registration as an investment adviser does not imply a certain level of skill or training. The oral and written communications of an adviser provide you with information about which you determine to hire or retain an adviser. Blue Ridge Wealth Planners Form ADV Part 2A & 2B can be obtained by going to www.adviserinfo.sec.gov. and searching the firms name. Neither the information nor any opinion expressed it so be construed as solicitation to buy or sell a security of personalized investment, tax, or legal advice.
Market Update: August 21 - 25, 2023

Weekly Summary
Jerome Powell and other members of the Federal Reserve spoke at the Jackson Hole Symposium this week and his remarks were largely unchanged from the messaging at July’s meeting. The equity, fixed income, and commodity markets were fairly stable last week with most prices ending Friday at close to same levels as market open Monday. This Thursday the Personal Consumption Expenditure Price Index measure of inflation is set to release. This economic indicator is especially important because it’s the inflation measure that the Federal Reserve pays closest attention to. Futures markets are predicting that peak interest rates are close to being reached with the potential of one more increase by the end of the year, before lowering some time in 2024 or early 2025.
Economic Data
US durable goods orders dropped 5.2% this month, below the forecasted 4% drop and a potential sign that the economy is slowing down as the Federal Reserve hopes. Consumer sentiment was also slightly below the forecast at 69.5 versus 71.2. The main topic of discussion this week were the statements made by Fed Chair Jerome Powel and other members of the Federal Open Market Committee at the annual Jackson Hole Symposium. In a speech on Friday Powell remained consistent with previous statements and stated that further rate hikes this year are still a possibility. However, futures markets are only predicting a 53% chance of a rate increase by the December Fed meeting. The Personal Consumption Expenditure Price Index, the Fed’s preferred measure of inflation, is set to release on Thursday and will have a large influence the Fed’s decision on where to set rates going forward.
Equities
The equity market started the week strong with a 1.7% gain in the S&P 500 from market open Monday until mid-day Thursday. However, there appeared to be some fear over potential volatility surrounding Fed Chair Powell’s speech and by market close on Thursday prices had returned to Monday’s levels. Equity markets reacted surprisingly well to Powell’s speech on Friday ending the day up 0.37% despite Powell’s insistence that further rate hikes were still on the table. One major topic of discussion this week was Nvidia’s earning report. The chipmaker released explosive earnings, doubling revenue from a year earlier due to heavy involvement in the booming AI industry. This boosted both the Nasdaq 100 and S&P 500 and contributed heavily to market gains Wednesday morning. Nvidia is now the sixth largest company in the world surpassing even Warren Buffett’s Berkshire Hathaway in market cap.
Fixed Income
Us rates were largely unchanged this week though the long-term end of the yield curve did drop slightly, a potential sign that investors believe rate increases will soon be coming to an end. Investor sentiment appears to imply we are already at or nearing peak interest rates in the US, but that the Federal Reserve may keep rates high for longer than previously expected with cuts coming some time in 2024 or early 2025. On Thursday Turkey’s central bank increased rates 7.5% to a staggering 25% in an attempt to boost their struggling currency, the Lira. In comparison to the US Dollar the Lira has lost over 30% of its value this year alone with most losses occurring in July. Turkey has struggled heavily with inflation in the post-Covid era and inflation rates in the country reached over 85% last year.
Commodities
Oil prices dropped slightly in the first half of last week but returned to roughly $80.00 by Friday. While Saudia Arabia and OPEC have continued to restrict supplies, slow economic growth in China has reduced demand and largely offset this. The threat of a union strike at several major facilities in Australia has caused the price of natural gas to be slightly more volatile than normal, but both sides appear to be close to reaching an agreement. The price of gold and silver rose slightly, reversing some of the decrease from earlier this month.
Interesting Articles
- CNBC: European markets close lower as Nvidia-led rally fades ahead of Jackson Hole
- Wall Street Journal: Mortgage Rates Hit 7.23%, Highest Since 2001
- Bloomberg: Powell Is Using Jackson Hole as Final Push in Inflation Fight
All data and figures in this article were collected from YCharts, Inc. on 08/28/2023 by Zach Hill of Blue Ridge Wealth Planners unless otherwise cited.
This material represents an assessment of the market and economic environment at a specific point in time and is not intended to be a forecast of future events, or a guarantee of future results. Forward-looking statements are subject to certain risks and uncertainties. Actual results, performance, or achievements may differ materially from those expressed or implied. Information is based on data gathered from what we believe are reliable sources. It is not guaranteed as to accuracy, does not purport to be complete and is not intended to be used as a primary basis for investment decisions. It should also not be construed as advice meeting the particular investment needs of any investor. Past performance does not guarantee future results.
Investments in emerging markets may be more volatile and less liquid than investing in developed markets and may involve exposure to economic structures that are generally less diverse and mature and to political systems which have less stability than those of more developed countries.
Investments in commodities may have greater volatility than investments in traditional securities, particularly if the instruments involve leverage. The value of commodity-linked derivative instruments may be affected by changes in overall market movements, commodity index volatility, changes in interest rates or factors affecting a particular industry or commodity, such as drought, floods, weather, livestock disease, embargoes, tariffs and international economic, political and regulatory developments. Use of leveraged commodity-linked derivatives creates an opportunity for increased return but, at the same time, creates the possibility for greater loss.
An index is an unmanaged portfolio of specific securities, the performance of which is often used as a benchmark in judging the relative performance of certain asset classes. Investors cannot invest directly in an index. An index does not charge management fees or brokerage expenses, and no such fees or expenses were deducted from the performance shown.
The Standard & Poor's 500 (S&P 500) is an unmanaged group of securities considered to be representative of the stock market in general. It is a market value weighted index with each stock's weight in the index proportionate to its market value.
The Financial Times Stock Exchange 100 Index, also called the FTSE 100 Index, FTSE 100, FTSE, or, informally, the "Footsie" is a share index of the 100 companies listed on the London Stock Exchange with the highest market capitalization. It is seen as a gauge of prosperity for businesses regulated by UK company law.
The FTSE Developed Europe Index is an index of European stocks, part of the FTSE Global Equity Index Series. It is a subset of the FTSE Europe Index. The FTSE Eurobloc Index is a subset of it.
The MSCI Emerging Markets Index is a float-adjusted market capitalization index that consists of indices in 21 emerging economies: Brazil, Chile, China, Colombia, Czech Republic, Egypt, Hungary, India, Indonesia, Korea, Malaysia, Mexico, Morocco, Peru, Philippines, Poland, Russia, South Africa, Taiwan, Thailand, and Turkey.
The Bloomberg Barclays US Aggregate Bond Index, or the Agg, is a broad base, market capitalization-weighted bond market index representing intermediate term investment grade bonds traded in the United States. Investors frequently use the index as a stand-in for measuring the performance of the US bond market.
The US Dollar Index (USDX, DXY) is an index (or measure) of the value of the United States dollar relative to a basket of foreign currencies, often referred to as a basket of US trade partners' currencies.
The Consumer Price Index (CPI) is a measure of inflation compiled by the US Bureau of Labor Studies.
West Texas Intermediate (WTI), also known as Texas light sweet, is a grade of crude oil used as a benchmark in oil pricing. This grade is described as light because of its relatively low density, and sweet because of its low sulfur content.
The Producer Price Index (PPI) is a family of indexes that measures the average change over time in selling prices received by domestic producers of goods and services. PPIs measure price change from the perspective of the seller.
This report was prepared by Blue Ridge Wealth Planners, a federally registered investment adviser under the Investment Advisers Act of 1940. Registration as an investment adviser does not imply a certain level of skill or training. The oral and written communications of an adviser provide you with information about which you determine to hire or retain an adviser. Blue Ridge Wealth Planners Form ADV Part 2A & 2B can be obtained by going to www.adviserinfo.sec.gov. and searching the firms name. Neither the information nor any opinion expressed it so be construed as solicitation to buy or sell a security of personalized investment, tax, or legal advice.
Market Update: August 14 - 18, 2023

Weekly Summary
US retail sales rose 0.7% in July and several major retailers have recently reported higher than expected earnings. Canada, the UK, and Japan all reported higher than expected inflation metrics and these combined factors led to an increase in the expectation that the Federal Reserve will raise rates another time before the end of this year. Despite this, equity markets are still far above the lows reached in March 2020. Oil prices remained consistent after reaching nine-month highs earlier this month as a result of continued supply cuts by Saudi Arabia.
Economic Data
US retail sales data for July was released on Tuesday, showing a 0.7% increase from June versus the expected 0.4%. June’s data was also revised up from 0.2% to 0.3%. Amazon, Walmart, Target, and Home Depot have now all reported higher than expected earnings for this quarter with Amazon stating they recently had their strongest day of sales in the history of the company. Canada, the UK, and Japan all reported slightly higher than expected inflation and Japanese GDP growth was almost twice the forecast at 6%. These factors increased fear that the economy may not be cooling quickly enough and that the Federal Reserve may decide to keep interest rates higher for longer than previously expected.
Equities
The S&P 500, Nasdaq 100, and Dow Jones Industrial Average all fell last week because of an increased expectation that the Federal Reserve will increase rates another time this year. Chairman Powell and other FOMC members have repeatedly stated that another hike may be coming before interest rates reach their peak, but futures markets were previously predicting very little chance of this actually occurring. Markets are now predicting a slightly over 40% chance of a rate increase by the November Fed meeting. Nearly all companies in the S&P 500 reported strong earnings this quarter, but investors seem to believe they market may have got ahead of itself as the bull market that has lasted since the beginning of this year appears to be coming to an end.
Fixed Income
On Tuesday Russia’s central bank raised interest rates 3.5% to 12% in a surprise decision in an effort to support the price of the ruble. China chose to move in the opposite direction, reducing its one-year rate from 3.55% to 3.45% in an effort to boost their struggling real estate sector. The economic data released last week has fed into what some have referred to as a “good news is bad news” mentality. A strong economy is good for the US in the short term, but it also means that the Fed’s fight to get inflation back to their 2% target may not happen as fast as the central bank hopes.
Commodities
Oil prices remained fairly consistent last week after reaching nine-month highs earlier in the month. Saudi Arabia and Russia have continued to restrict supplies despite already high prices, though prices are still far below the highs reached in June of last year. Natural gas prices were also largely unchanged as the heat waves that previously plagued the country have begun to moderate. The price of gold and silver have continued to slowly decrease after the US reported lower than expected inflation rates earlier this month.
Interesting Articles
- CNBC: Walmart raises full-year earnings forecast as grocery, online growth fuel higher sales
- CNN Business: China disappoints investors with ‘underwhelming’ decision on key interest rate
- Wall Street Journal: Is It Time to Worry About Consumer Debt? What Is Going On in Seven Charts
All data and figures in this article were collected from YCharts, Inc. on 08/21/2023 by Zach Hill of Blue Ridge Wealth Planners unless otherwise cited.
This material represents an assessment of the market and economic environment at a specific point in time and is not intended to be a forecast of future events, or a guarantee of future results. Forward-looking statements are subject to certain risks and uncertainties. Actual results, performance, or achievements may differ materially from those expressed or implied. Information is based on data gathered from what we believe are reliable sources. It is not guaranteed as to accuracy, does not purport to be complete and is not intended to be used as a primary basis for investment decisions. It should also not be construed as advice meeting the particular investment needs of any investor. Past performance does not guarantee future results.
Investments in emerging markets may be more volatile and less liquid than investing in developed markets and may involve exposure to economic structures that are generally less diverse and mature and to political systems which have less stability than those of more developed countries.
Investments in commodities may have greater volatility than investments in traditional securities, particularly if the instruments involve leverage. The value of commodity-linked derivative instruments may be affected by changes in overall market movements, commodity index volatility, changes in interest rates or factors affecting a particular industry or commodity, such as drought, floods, weather, livestock disease, embargoes, tariffs and international economic, political and regulatory developments. Use of leveraged commodity-linked derivatives creates an opportunity for increased return but, at the same time, creates the possibility for greater loss.
An index is an unmanaged portfolio of specific securities, the performance of which is often used as a benchmark in judging the relative performance of certain asset classes. Investors cannot invest directly in an index. An index does not charge management fees or brokerage expenses, and no such fees or expenses were deducted from the performance shown.
The Standard & Poor's 500 (S&P 500) is an unmanaged group of securities considered to be representative of the stock market in general. It is a market value weighted index with each stock's weight in the index proportionate to its market value.
The Financial Times Stock Exchange 100 Index, also called the FTSE 100 Index, FTSE 100, FTSE, or, informally, the "Footsie" is a share index of the 100 companies listed on the London Stock Exchange with the highest market capitalization. It is seen as a gauge of prosperity for businesses regulated by UK company law.
The FTSE Developed Europe Index is an index of European stocks, part of the FTSE Global Equity Index Series. It is a subset of the FTSE Europe Index. The FTSE Eurobloc Index is a subset of it.
The MSCI Emerging Markets Index is a float-adjusted market capitalization index that consists of indices in 21 emerging economies: Brazil, Chile, China, Colombia, Czech Republic, Egypt, Hungary, India, Indonesia, Korea, Malaysia, Mexico, Morocco, Peru, Philippines, Poland, Russia, South Africa, Taiwan, Thailand, and Turkey.
The Bloomberg Barclays US Aggregate Bond Index, or the Agg, is a broad base, market capitalization-weighted bond market index representing intermediate term investment grade bonds traded in the United States. Investors frequently use the index as a stand-in for measuring the performance of the US bond market.
The US Dollar Index (USDX, DXY) is an index (or measure) of the value of the United States dollar relative to a basket of foreign currencies, often referred to as a basket of US trade partners' currencies.
The Consumer Price Index (CPI) is a measure of inflation compiled by the US Bureau of Labor Studies.
West Texas Intermediate (WTI), also known as Texas light sweet, is a grade of crude oil used as a benchmark in oil pricing. This grade is described as light because of its relatively low density, and sweet because of its low sulfur content.
The Producer Price Index (PPI) is a family of indexes that measures the average change over time in selling prices received by domestic producers of goods and services. PPIs measure price change from the perspective of the seller.
This report was prepared by Blue Ridge Wealth Planners, a federally registered investment adviser under the Investment Advisers Act of 1940. Registration as an investment adviser does not imply a certain level of skill or training. The oral and written communications of an adviser provide you with information about which you determine to hire or retain an adviser. Blue Ridge Wealth Planners Form ADV Part 2A & 2B can be obtained by going to www.adviserinfo.sec.gov. and searching the firms name. Neither the information nor any opinion expressed it so be construed as solicitation to buy or sell a security of personalized investment, tax, or legal advice.
Market Update: July 31 - August 4, 2023

Weekly Summary
Several key economic readings released this week hint that interest rate increases may finally be taking effect and slowing the economy down, although unemployment remains low. Key US inflation measures will be releasing later this week that will shed light on if the Federal Reserve’s battle with inflation is over, or if further rate increases may still be needed. Equity markets had their worst week since March but regained some losses at market open Monday morning. Futures markets are still predicting little chance of Fed hikes this year and long-term rates rose slightly, marking some progress in reversing the yield curve’s inverted state.
Economic Data
On Monday core Eurozone inflation released at 5.5% year-over-year, slightly above the forecast of 5.4% and consistent with last month’s report. However, Eurozone GDP growth came in above expectations at 0.6% year-over-year versus the predicted 0.5%. US Non-Farm Payrolls released Friday below the 200k expectation at 187k, while June’s numbers were revised down to 185k from 209k. We may be beginning to see signs of the economy slowing down as the major rate hikes from several central banks finally take effect, meaning peak interest rates in the US may have already been reached. However, unemployment remains low at only 3.5%, under the forecast and below last month’s reading of 3.6%. Both the Consumer and Producer Price Index measures of US inflation will release this week which will shed light on the Fed’s direction going forward.
Equities
The S&P 500, Nasdaq 100, and Dow Jones Industrial Average all fell last week having their worst week since March after strong performance over the previous month. However, the indices are far above the market bottom in September of last year and are still very close to the all-time highs reached at the beginning of 2022. Some of last week’s losses have already been reversed as of market open Monday morning after strong earnings reports by Berkshire Hathaway and Boeing. About 85% of the companies in the S&P 500 have now reported quarterly earnings and 80% of those companies exceeded Wall Street forecasts, marking a stronger earning season overall than expected. In general investors seem cautiously optimistic as they await the release of inflation data later this week.
Fixed Income
The Bank of England followed the Federal Reserve and increased interest rates by one quarter of a percent on Thursday. The US yield curve was mostly unchanged although long term rates rose slightly, slowly inching towards a reversal of the inversion that the US has faced since the middle of last year. Futures markets are predicting about a 10-15% chance of a hike at the Fed’s September meeting and about a 25-30% chance of a hike by the end of the year, although this may change following the release of economic data later this week.
Commodities
WTI and Brent crude oil prices have been slowly increasing since the end of June although they still remain far from the highs reached last year following the Russian invasion of Ukraine. Natural gas prices have remained fairly consistent and are also far below the $7.00-$9.00 range reached during the same period. Gold and Silver also changed little in price following the slight increase the week before after the Federal Reserve announced its rate decision.
Interesting Articles
- CNBC: Fitch downgrades U.S. long-term rating to AA+ from AAA
- Wall Street Journal: Car Dealer Markups Helped Drive Inflation, Study Finds
- CNBC: Amazon reports blowout profit, beats on sales and issues optimistic guidance
All data and figures in this article were collected from YCharts, Inc. on 08/07/2023 by Zach Hill of Blue Ridge Wealth Planners unless otherwise cited.
This material represents an assessment of the market and economic environment at a specific point in time and is not intended to be a forecast of future events, or a guarantee of future results. Forward-looking statements are subject to certain risks and uncertainties. Actual results, performance, or achievements may differ materially from those expressed or implied. Information is based on data gathered from what we believe are reliable sources. It is not guaranteed as to accuracy, does not purport to be complete and is not intended to be used as a primary basis for investment decisions. It should also not be construed as advice meeting the particular investment needs of any investor. Past performance does not guarantee future results.
Investments in emerging markets may be more volatile and less liquid than investing in developed markets and may involve exposure to economic structures that are generally less diverse and mature and to political systems which have less stability than those of more developed countries.
Investments in commodities may have greater volatility than investments in traditional securities, particularly if the instruments involve leverage. The value of commodity-linked derivative instruments may be affected by changes in overall market movements, commodity index volatility, changes in interest rates or factors affecting a particular industry or commodity, such as drought, floods, weather, livestock disease, embargoes, tariffs and international economic, political and regulatory developments. Use of leveraged commodity-linked derivatives creates an opportunity for increased return but, at the same time, creates the possibility for greater loss.
An index is an unmanaged portfolio of specific securities, the performance of which is often used as a benchmark in judging the relative performance of certain asset classes. Investors cannot invest directly in an index. An index does not charge management fees or brokerage expenses, and no such fees or expenses were deducted from the performance shown.
The Standard & Poor's 500 (S&P 500) is an unmanaged group of securities considered to be representative of the stock market in general. It is a market value weighted index with each stock's weight in the index proportionate to its market value.
The Financial Times Stock Exchange 100 Index, also called the FTSE 100 Index, FTSE 100, FTSE, or, informally, the "Footsie" is a share index of the 100 companies listed on the London Stock Exchange with the highest market capitalization. It is seen as a gauge of prosperity for businesses regulated by UK company law.
The FTSE Developed Europe Index is an index of European stocks, part of the FTSE Global Equity Index Series. It is a subset of the FTSE Europe Index. The FTSE Eurobloc Index is a subset of it.
The MSCI Emerging Markets Index is a float-adjusted market capitalization index that consists of indices in 21 emerging economies: Brazil, Chile, China, Colombia, Czech Republic, Egypt, Hungary, India, Indonesia, Korea, Malaysia, Mexico, Morocco, Peru, Philippines, Poland, Russia, South Africa, Taiwan, Thailand, and Turkey.
The Bloomberg Barclays US Aggregate Bond Index, or the Agg, is a broad base, market capitalization-weighted bond market index representing intermediate term investment grade bonds traded in the United States. Investors frequently use the index as a stand-in for measuring the performance of the US bond market.
The US Dollar Index (USDX, DXY) is an index (or measure) of the value of the United States dollar relative to a basket of foreign currencies, often referred to as a basket of US trade partners' currencies.
The Consumer Price Index (CPI) is a measure of inflation compiled by the US Bureau of Labor Studies.
West Texas Intermediate (WTI), also known as Texas light sweet, is a grade of crude oil used as a benchmark in oil pricing. This grade is described as light because of its relatively low density, and sweet because of its low sulfur content.
The Producer Price Index (PPI) is a family of indexes that measures the average change over time in selling prices received by domestic producers of goods and services. PPIs measure price change from the perspective of the seller.
This report was prepared by Blue Ridge Wealth Planners, a federally registered investment adviser under the Investment Advisers Act of 1940. Registration as an investment adviser does not imply a certain level of skill or training. The oral and written communications of an adviser provide you with information about which you determine to hire or retain an adviser. Blue Ridge Wealth Planners Form ADV Part 2A & 2B can be obtained by going to www.adviserinfo.sec.gov. and searching the firms name. Neither the information nor any opinion expressed it so be construed as solicitation to buy or sell a security of personalized investment, tax, or legal advice.
Market Update: July 24 - 28, 2023

Weekly Summary
On Wednesday the Federal Reserve announced an expected rate increase of 0.25%. Equity markets rallied on Friday following a positive release of the Personal Consumption Expenditures measure of inflation. The European Central Bank also announced a rate increase, but investors appear to be becoming more and more optimistic as inflation rates continue to fall in most major economies while employment metrics and consumer confidence remain strong. For the first time in two years wages are growing at a faster rate than inflation. Oil prices continue to creep up with WTI now above $80 a barrel while natural gas fell slightly as heat waves begin to moderate in the northeast.
Economic Data
On Wednesday the Federal Reserve raised interest rates by one quarter of a percent to 5.5% as expected. The European Central Bank followed suit and also raised rates by a quarter of percent to 4.25%. Fed Chair Jerome Powell made it clear that another rate increase at one of the three remaining Fed meetings this year is still a possibility, though futures markets are currently predicting only about a 30% chance of another hike before cuts begin in the first half of next year. On Friday the Personal Consumption Expenditure Price Index was released and showed year over year inflation at just 3.0%, finally within range of the Fed’s 2% goal. Core PCE inflation also came in below expectations at 4.1% down from 4.7% in May.
Equities
The S&P 500 rose slightly over 1% last week as investors were seemingly unbothered by rate hike announcements by both the Fed and ECB. Markets reacted especially positively to the PCE inflation announcements with the bulk of gains coming Friday morning. The NASDAQ-100 and Dow Jones Industrial Average were also both up for the week and equity markets are finally creeping closer to the all-time highs achieved in late 2021. Investors appear to be becoming increasingly optimistic that the Fed will be able to successfully curb inflation while avoiding a potential recession.
Fixed Income
Short term rates were largely unchanged last week while long term rates rose slightly following the Fed’s rate increase announcement. The yield curve remains heavily inverted with 2-year Treasuries yielding nearly a full percent more than their 10-year counterparts. The Bank of Japan kept rates unchanged and is still the only major central bank offering negative short-term yields. Unlike most developed economies Japan is currently suffering more heavily from slow economic growth than inflation and government officials stated a commitment to keeping borrowing costs low in hope of boosting investments in domestic businesses. Futures markets are predicting that US short term rates will stay consistent for the rest of the year before being lowered at either the March or May Fed meeting in 2024.
Commodities
WTI and Brent oil prices continue to creep up following announced inventory cuts by Saudi Arabia and continued sanctions on Russia by the US and most other western nations. Natural gas fell slightly last week as the end of the heat waves plaguing most the US seems to finally be in sight. Gold and silver prices fell sharply Thursday morning following the Fed announcement but recovered Friday with gold now re-approaching its all-time high.
Interesting Articles
- CNBC: Fed approves hike that takes interest rates to highest level in more than 22 years
- CNN Business: The Fed’s favorite inflation measure cooled down even further in June
- Wall Street Journal: Pay Raises Are Finally Beating Inflation After Two Years of Falling Behind
All data and figures in this article were collected from YCharts, Inc. on 07/31/2023 by Zach Hill of Blue Ridge Wealth Planners unless otherwise cited.
This material represents an assessment of the market and economic environment at a specific point in time and is not intended to be a forecast of future events, or a guarantee of future results. Forward-looking statements are subject to certain risks and uncertainties. Actual results, performance, or achievements may differ materially from those expressed or implied. Information is based on data gathered from what we believe are reliable sources. It is not guaranteed as to accuracy, does not purport to be complete and is not intended to be used as a primary basis for investment decisions. It should also not be construed as advice meeting the particular investment needs of any investor. Past performance does not guarantee future results.
Investments in emerging markets may be more volatile and less liquid than investing in developed markets and may involve exposure to economic structures that are generally less diverse and mature and to political systems which have less stability than those of more developed countries.
Investments in commodities may have greater volatility than investments in traditional securities, particularly if the instruments involve leverage. The value of commodity-linked derivative instruments may be affected by changes in overall market movements, commodity index volatility, changes in interest rates or factors affecting a particular industry or commodity, such as drought, floods, weather, livestock disease, embargoes, tariffs and international economic, political and regulatory developments. Use of leveraged commodity-linked derivatives creates an opportunity for increased return but, at the same time, creates the possibility for greater loss.
An index is an unmanaged portfolio of specific securities, the performance of which is often used as a benchmark in judging the relative performance of certain asset classes. Investors cannot invest directly in an index. An index does not charge management fees or brokerage expenses, and no such fees or expenses were deducted from the performance shown.
The Standard & Poor's 500 (S&P 500) is an unmanaged group of securities considered to be representative of the stock market in general. It is a market value weighted index with each stock's weight in the index proportionate to its market value.
The Financial Times Stock Exchange 100 Index, also called the FTSE 100 Index, FTSE 100, FTSE, or, informally, the "Footsie" is a share index of the 100 companies listed on the London Stock Exchange with the highest market capitalization. It is seen as a gauge of prosperity for businesses regulated by UK company law.
The FTSE Developed Europe Index is an index of European stocks, part of the FTSE Global Equity Index Series. It is a subset of the FTSE Europe Index. The FTSE Eurobloc Index is a subset of it.
The MSCI Emerging Markets Index is a float-adjusted market capitalization index that consists of indices in 21 emerging economies: Brazil, Chile, China, Colombia, Czech Republic, Egypt, Hungary, India, Indonesia, Korea, Malaysia, Mexico, Morocco, Peru, Philippines, Poland, Russia, South Africa, Taiwan, Thailand, and Turkey.
The Bloomberg Barclays US Aggregate Bond Index, or the Agg, is a broad base, market capitalization-weighted bond market index representing intermediate term investment grade bonds traded in the United States. Investors frequently use the index as a stand-in for measuring the performance of the US bond market.
The US Dollar Index (USDX, DXY) is an index (or measure) of the value of the United States dollar relative to a basket of foreign currencies, often referred to as a basket of US trade partners' currencies.
The Consumer Price Index (CPI) is a measure of inflation compiled by the US Bureau of Labor Studies.
West Texas Intermediate (WTI), also known as Texas light sweet, is a grade of crude oil used as a benchmark in oil pricing. This grade is described as light because of its relatively low density, and sweet because of its low sulfur content.
The Producer Price Index (PPI) is a family of indexes that measures the average change over time in selling prices received by domestic producers of goods and services. PPIs measure price change from the perspective of the seller.
This report was prepared by Blue Ridge Wealth Planners, a federally registered investment adviser under the Investment Advisers Act of 1940. Registration as an investment adviser does not imply a certain level of skill or training. The oral and written communications of an adviser provide you with information about which you determine to hire or retain an adviser. Blue Ridge Wealth Planners Form ADV Part 2A & 2B can be obtained by going to www.adviserinfo.sec.gov. and searching the firms name. Neither the information nor any opinion expressed it so be construed as solicitation to buy or sell a security of personalized investment, tax, or legal advice.
Market Update: July 17 - 21, 2023

Weekly Summary
Equity and fixed income markets were fairly quiet this week as investors await the Federal Reserve meeting this Wednesday. It’s widely expected that the Fed will raise interest rates by another quarter of a percent, but perhaps more important is the Fed’s outlook for the rest of the year. The Fed’s press conference is likely to shed light on whether rates will rise another time this year as Powell previously suggested, or if this is the peak with inflation seemingly coming under control. Oil and Natural gas rose slightly due to ongoing heat waves and hopes of Chinese government stimulus. The European Central Bank and Bank of Japan are also set to announce their interest rate decisions this week.
Economic Data
Both New Zealand and the Euro Area reported inflation metrics last week that were very slightly above forecasts, but not enough out of line to cause any significant fear. The Euro Area has struggled to get inflation under control, but core rates are now starting to approach US levels. Euro Area core inflation was 5.5% year over year compared to 4.8% in the US. Canada also reported inflation metrics last week and is at only 2.8% year over year, in line with the US headline rate. US retail sales are still growing monthly but came in slightly below forecasts, while building permits were also slightly lower than expected. US PCE, the Fed’s preferred measure of inflation, releases this Friday and will have a large impact on the Fed’s decision to either hike or pause at September’s meeting.
Equities
The S&P 500 rose slightly last week but was mostly flat with growth of only 0.6%. The NASDAQ-100 started the week strong but retraced all gains Wednesday through Friday, resulting in a loss of 1.1%. Much of this was driven by a special rebalance of the index’s weights which goes into effect today. A special rebalance of the NASDAQ-100 is triggered when only a few companies make up over 48% of the overall index, which recently occurred following the extremely strong performance of tech giants like Apple, Microsoft, Google, Nvidia, Amazon, and Tesla. The Dow Jones Industrial Average performed well last week and ended Friday up 2.1%. Markets will likely be slightly more volatile than average this week as normal during periods surrounding a Fed decision.
Fixed Income
Short term interest rates continue to rise on the expectation that the Fed will increase rates by a quarter of a percent at Wednesday’s Fed meeting. The futures’ market is in near unanimous agreement about this predicting only a 0.2% chance of the Fed deciding to pause rates at this meeting. Long term Treasury rates fell slightly as although a rate hike is expected, markets seem to believe that this will be the peak rate with no more hikes to follow this year. The European Central Bank and Bank of Japan are also set to meet this week, with the ECB expected to follow the US in increasing rates by a quarter of a percent and the BOJ expected to keep rates flat.
Commodities
Gold rallied early last week before retracing most of its gains on Thursday and Friday. However, this still marks the third week in a row gold has ended with a positive return. Natural gas rose 6% as both North America and Europe have continued to be affected by some of the strongest heatwaves in years. Despite this, natural gas prices are still much lower than they were in the previous two summers, due to large stockpiles after an unusually warm winter and an increase in output from renewable energy in large states like California and Texas. Oil prices rose slightly out of hope that the Chinese government will implement further stimulus after weak GDP growth in the second quarter.
Interesting Articles
- Morningstar: Nasdaq Changes: Tech's Magnificent Seven Force Rebalance
- Wall Street Journal: Why This Heat Isn’t Cranking Up Your Gas Bill
- Fortune: The bear market is dying after less than 20 months as almost $10 trillion floods back into equity values
All data and figures in this article were collected from YCharts, Inc. on 07/24/2023 by Zach Hill of Blue Ridge Wealth Planners unless otherwise cited.
This material represents an assessment of the market and economic environment at a specific point in time and is not intended to be a forecast of future events, or a guarantee of future results. Forward-looking statements are subject to certain risks and uncertainties. Actual results, performance, or achievements may differ materially from those expressed or implied. Information is based on data gathered from what we believe are reliable sources. It is not guaranteed as to accuracy, does not purport to be complete and is not intended to be used as a primary basis for investment decisions. It should also not be construed as advice meeting the particular investment needs of any investor. Past performance does not guarantee future results.
Investments in emerging markets may be more volatile and less liquid than investing in developed markets and may involve exposure to economic structures that are generally less diverse and mature and to political systems which have less stability than those of more developed countries.
Investments in commodities may have greater volatility than investments in traditional securities, particularly if the instruments involve leverage. The value of commodity-linked derivative instruments may be affected by changes in overall market movements, commodity index volatility, changes in interest rates or factors affecting a particular industry or commodity, such as drought, floods, weather, livestock disease, embargoes, tariffs and international economic, political and regulatory developments. Use of leveraged commodity-linked derivatives creates an opportunity for increased return but, at the same time, creates the possibility for greater loss.
An index is an unmanaged portfolio of specific securities, the performance of which is often used as a benchmark in judging the relative performance of certain asset classes. Investors cannot invest directly in an index. An index does not charge management fees or brokerage expenses, and no such fees or expenses were deducted from the performance shown.
The Standard & Poor's 500 (S&P 500) is an unmanaged group of securities considered to be representative of the stock market in general. It is a market value weighted index with each stock's weight in the index proportionate to its market value.
The Financial Times Stock Exchange 100 Index, also called the FTSE 100 Index, FTSE 100, FTSE, or, informally, the "Footsie" is a share index of the 100 companies listed on the London Stock Exchange with the highest market capitalization. It is seen as a gauge of prosperity for businesses regulated by UK company law.
The FTSE Developed Europe Index is an index of European stocks, part of the FTSE Global Equity Index Series. It is a subset of the FTSE Europe Index. The FTSE Eurobloc Index is a subset of it.
The MSCI Emerging Markets Index is a float-adjusted market capitalization index that consists of indices in 21 emerging economies: Brazil, Chile, China, Colombia, Czech Republic, Egypt, Hungary, India, Indonesia, Korea, Malaysia, Mexico, Morocco, Peru, Philippines, Poland, Russia, South Africa, Taiwan, Thailand, and Turkey.
The Bloomberg Barclays US Aggregate Bond Index, or the Agg, is a broad base, market capitalization-weighted bond market index representing intermediate term investment grade bonds traded in the United States. Investors frequently use the index as a stand-in for measuring the performance of the US bond market.
The US Dollar Index (USDX, DXY) is an index (or measure) of the value of the United States dollar relative to a basket of foreign currencies, often referred to as a basket of US trade partners' currencies.
The Consumer Price Index (CPI) is a measure of inflation compiled by the US Bureau of Labor Studies.
West Texas Intermediate (WTI), also known as Texas light sweet, is a grade of crude oil used as a benchmark in oil pricing. This grade is described as light because of its relatively low density, and sweet because of its low sulfur content.
The Producer Price Index (PPI) is is a family of indexes that measures the average change over time in selling prices received by domestic producers of goods and services. PPIs measure price change from the perspective of the seller.
This report was prepared by Blue Ridge Wealth Planners, a federally registered investment adviser under the Investment Advisers Act of 1940. Registration as an investment adviser does not imply a certain level of skill or training. The oral and written communications of an adviser provide you with information about which you determine to hire or retain an adviser. Blue Ridge Wealth Planners Form ADV Part 2A & 2B can be obtained by going to www.adviserinfo.sec.gov. and searching the firms name. Neither the information nor any opinion expressed it so be construed as solicitation to buy or sell a security of personalized investment, tax, or legal advice.
Market Update: July 10 - 14, 2023

Weekly Summary
Both the consumer and producer price indices came in lower-than-expected last week, boosting equity markets and slightly lowering long term rates. The Federal Reserve was previously expected to raise rates at both the July and September meetings, but the futures market is now predicting rates will peak in July and begin to decrease sometime early next year. Slowing inflation combined with low unemployment and strong earnings by several major banks are alleviating fears that the US economy is entering a recession.
Economic Data
The Consumer Price Index inflation measure released Wednesday at 3%, slightly below the forecast of 3.1%. Core inflation, which excludes food and energy prices, also came in below estimates at 4.8% versus the expected 5%. The Producer Price Index released the following day at only 0.1% year over year. PPI is often considered a leading indicator for overall inflation because companies tend to pass higher prices on to customers, so this is some additional good news for the average consumer. We are now only 1% over the Fed’s year over year inflation target and a so called “soft landing” is appearing to be a more and more possible outcome.
Equities
The S&P 500 rose roughly 2.5% last week following the good news on inflation while the NASDAQ-100 rose 3.6%. Several major banks like JPMorgan Chase, Wells Fargo, and Citigroup released earnings last week and all performed better than expected, increasing optimism about the current state of the US financial sector. Equity markets are finally re-approaching the all-time highs reached at the beginning of 2022 and investors seem to believe the US economy is still strong despite the expectation of one or two further rate increases.
Fixed Income
Long term rates dropped slightly last week with the 10 and 30-year now back below 4%. Futures markets are still predicting that the Fed will raise rates by another 0.25% at the July 26th meeting. Powell has previously indicated that a further hike could come in September, but markets are also predicting July’s rates will be the peak and that cuts could begin as early as January or March of next year. Personal Consumption Expenditures, the Fed’s preferred measure of inflation, will release two days after the next Fed meeting and provide further insight on what to expect from the Fed in the rest of the year.
Commodities
Oil prices rose slightly last week but returned to previous levels after Chinese GDP growth came in lower than expected. China is the world’s biggest importer of oil, and their manufacturing-based economy continues to struggle to recover following the removal of many Zero Covid policies. Natural gas prices fell after several previously closed Norwegian gas fields returned from maintenance. Norway is now Europe’s largest natural gas supplier and prices over the next several months are likely to hinge on how severe the weather is this winter.
Interesting Articles
- The Hill: Biden administration announces $39 billion in student debt relief for 804,000 borrowers
- CNBC: Inflation rose just 0.2% in June, less than expected as consumers get a break from price increases
- Business Insider: Mexico replaced China as America's top trade buddy — and it shows how the global economy is rapidly transforming
All data and figures in this article were collected from YCharts, Inc. on 07/17/2023 by Zach Hill of Blue Ridge Wealth Planners unless otherwise cited.
This material represents an assessment of the market and economic environment at a specific point in time and is not intended to be a forecast of future events, or a guarantee of future results. Forward-looking statements are subject to certain risks and uncertainties. Actual results, performance, or achievements may differ materially from those expressed or implied. Information is based on data gathered from what we believe are reliable sources. It is not guaranteed as to accuracy, does not purport to be complete and is not intended to be used as a primary basis for investment decisions. It should also not be construed as advice meeting the particular investment needs of any investor. Past performance does not guarantee future results.
Investments in emerging markets may be more volatile and less liquid than investing in developed markets and may involve exposure to economic structures that are generally less diverse and mature and to political systems which have less stability than those of more developed countries.
Investments in commodities may have greater volatility than investments in traditional securities, particularly if the instruments involve leverage. The value of commodity-linked derivative instruments may be affected by changes in overall market movements, commodity index volatility, changes in interest rates or factors affecting a particular industry or commodity, such as drought, floods, weather, livestock disease, embargoes, tariffs and international economic, political and regulatory developments. Use of leveraged commodity-linked derivatives creates an opportunity for increased return but, at the same time, creates the possibility for greater loss.
An index is an unmanaged portfolio of specific securities, the performance of which is often used as a benchmark in judging the relative performance of certain asset classes. Investors cannot invest directly in an index. An index does not charge management fees or brokerage expenses, and no such fees or expenses were deducted from the performance shown.
The Standard & Poor's 500 (S&P 500) is an unmanaged group of securities considered to be representative of the stock market in general. It is a market value weighted index with each stock's weight in the index proportionate to its market value.
The Financial Times Stock Exchange 100 Index, also called the FTSE 100 Index, FTSE 100, FTSE, or, informally, the "Footsie" is a share index of the 100 companies listed on the London Stock Exchange with the highest market capitalization. It is seen as a gauge of prosperity for businesses regulated by UK company law.
The FTSE Developed Europe Index is an index of European stocks, part of the FTSE Global Equity Index Series. It is a subset of the FTSE Europe Index. The FTSE Eurobloc Index is a subset of it.
The MSCI Emerging Markets Index is a float-adjusted market capitalization index that consists of indices in 21 emerging economies: Brazil, Chile, China, Colombia, Czech Republic, Egypt, Hungary, India, Indonesia, Korea, Malaysia, Mexico, Morocco, Peru, Philippines, Poland, Russia, South Africa, Taiwan, Thailand, and Turkey.
The Bloomberg Barclays US Aggregate Bond Index, or the Agg, is a broad base, market capitalization-weighted bond market index representing intermediate term investment grade bonds traded in the United States. Investors frequently use the index as a stand-in for measuring the performance of the US bond market.
The US Dollar Index (USDX, DXY) is an index (or measure) of the value of the United States dollar relative to a basket of foreign currencies, often referred to as a basket of US trade partners' currencies.
The Consumer Price Index (CPI) is a measure of inflation compiled by the US Bureau of Labor Studies.
West Texas Intermediate (WTI), also known as Texas light sweet, is a grade of crude oil used as a benchmark in oil pricing. This grade is described as light because of its relatively low density, and sweet because of its low sulfur content.
The Producer Price Index (PPI) is is a family of indexes that measures the average change over time in selling prices received by domestic producers of goods and services. PPIs measure price change from the perspective of the seller.
This report was prepared by Blue Ridge Wealth Planners, a federally registered investment adviser under the Investment Advisers Act of 1940. Registration as an investment adviser does not imply a certain level of skill or training. The oral and written communications of an adviser provide you with information about which you determine to hire or retain an adviser. Blue Ridge Wealth Planners Form ADV Part 2A & 2B can be obtained by going to www.adviserinfo.sec.gov. and searching the firms name. Neither the information nor any opinion expressed it so be construed as solicitation to buy or sell a security of personalized investment, tax, or legal advice.
Market Update: July 3 - 7, 2023

Weekly Summary
Unemployment remains strong though the US economy is beginning to show signs of a slowdown after a lower-than-expected increase in jobs in June. Markets are cautiously awaiting the release of key inflation metrics later this week that are likely to guide the Fed’s monetary policy decisions over the rest of the year. The Q2 earnings season kicks off this week which will also provide further insight into the current state of the US economy.
Economic Data
Non-Farm Payrolls came in at 209k underperforming the forecast of 225k, the lowest increase in jobs in two and a half years. Despite this, unemployment remains strong matching the predicted 3.6%, down from 3.7% in May. A slowdown in job growth implies the Fed’s tightening policy is working which could mean rate cuts coming earlier than previously expected. ISM Manufacturing PMI was only narrowly below forecasts, while Services PMI surprised on the upside at 53.9 against a forecast of 51. Overall, the US economy is showing signs of resilience though fear of a potential recession remains.
Equities
The S&P 500 fell slightly over 1% last week reversing some of the gains since late June, although the index is still up over 15% year-to-date. All eyes will be on inflation this week with the Consumer Price Index releasing Wednesday and the Producer Price Index releasing the following day. Most major US companies will be releasing Q2 earnings over the next several weeks which could lead to some increased volatility in the markets and help provide additional clarity on to what extent the economy is slowing down.
Fixed Income
The yield curve changed little last week and remains heavily inverted. The 3-Month, 2-Year, 10-Year, and 30-Year all rose slightly on the expectation of a hike at the next Fed meeting. Futures markets are currently predicting an over 90% chance of a rate increase at the July 26 meeting and a rate cut is not expected until at least May of next year. CPI figures releasing on Wednesday, along with earnings reports from several major banks like JPMorgan Chase and Citigroup this week, are likely to heavily influence the Fed’s rate decision and path over the next several months.
Commodities
Oil prices rose slightly last week but returned to previous levels Monday morning as demand in the US and China is expected to decrease. Losses were slightly offset by expected crude supply cuts from Saudi Arabia and Russia. China is currently facing the opposite economic struggle as the US with year-over-year inflation coming in at 0%. China has continued to struggle with economic growth following the slow removal of many zero-COVID policies.
Interesting Articles
- CNBC: Britain is now the only major economy where inflation is still rising
- Reuters: Saudi Arabia says new oil cuts show teamwork with Russia is strong
- Yahoo Finance: Workers are still raiding their retirement savings at record rates
All data and figures in this article were collected from YCharts, Inc. on 07/10/2023 by Zach Hill of Blue Ridge Wealth Planners unless otherwise cited.
This material represents an assessment of the market and economic environment at a specific point in time and is not intended to be a forecast of future events, or a guarantee of future results. Forward-looking statements are subject to certain risks and uncertainties. Actual results, performance, or achievements may differ materially from those expressed or implied. Information is based on data gathered from what we believe are reliable sources. It is not guaranteed as to accuracy, does not purport to be complete and is not intended to be used as a primary basis for investment decisions. It should also not be construed as advice meeting the particular investment needs of any investor. Past performance does not guarantee future results.
Investments in emerging markets may be more volatile and less liquid than investing in developed markets and may involve exposure to economic structures that are generally less diverse and mature and to political systems which have less stability than those of more developed countries.
Investments in commodities may have greater volatility than investments in traditional securities, particularly if the instruments involve leverage. The value of commodity-linked derivative instruments may be affected by changes in overall market movements, commodity index volatility, changes in interest rates or factors affecting a particular industry or commodity, such as drought, floods, weather, livestock disease, embargoes, tariffs and international economic, political and regulatory developments. Use of leveraged commodity-linked derivatives creates an opportunity for increased return but, at the same time, creates the possibility for greater loss.
An index is an unmanaged portfolio of specific securities, the performance of which is often used as a benchmark in judging the relative performance of certain asset classes. Investors cannot invest directly in an index. An index does not charge management fees or brokerage expenses, and no such fees or expenses were deducted from the performance shown.
The Standard & Poor's 500 (S&P 500) is an unmanaged group of securities considered to be representative of the stock market in general. It is a market value weighted index with each stock's weight in the index proportionate to its market value.
The Financial Times Stock Exchange 100 Index, also called the FTSE 100 Index, FTSE 100, FTSE, or, informally, the "Footsie" is a share index of the 100 companies listed on the London Stock Exchange with the highest market capitalization. It is seen as a gauge of prosperity for businesses regulated by UK company law.
The FTSE Developed Europe Index is an index of European stocks, part of the FTSE Global Equity Index Series. It is a subset of the FTSE Europe Index. The FTSE Eurobloc Index is a subset of it.
The MSCI Emerging Markets Index is a float-adjusted market capitalization index that consists of indices in 21 emerging economies: Brazil, Chile, China, Colombia, Czech Republic, Egypt, Hungary, India, Indonesia, Korea, Malaysia, Mexico, Morocco, Peru, Philippines, Poland, Russia, South Africa, Taiwan, Thailand, and Turkey.
The Bloomberg Barclays US Aggregate Bond Index, or the Agg, is a broad base, market capitalization-weighted bond market index representing intermediate term investment grade bonds traded in the United States. Investors frequently use the index as a stand-in for measuring the performance of the US bond market.
The US Dollar Index (USDX, DXY) is an index (or measure) of the value of the United States dollar relative to a basket of foreign currencies, often referred to as a basket of US trade partners' currencies.
The Consumer Price Index (CPI) is a measure of inflation compiled by the US Bureau of Labor Studies.
West Texas Intermediate (WTI), also known as Texas light sweet, is a grade of crude oil used as a benchmark in oil pricing. This grade is described as light because of its relatively low density, and sweet because of its low sulfur content.
The Producer Price Index (PPI) is is a family of indexes that measures the average change over time in selling prices received by domestic producers of goods and services. PPIs measure price change from the perspective of the seller.
This report was prepared by Blue Ridge Wealth Planners, a federally registered investment adviser under the Investment Advisers Act of 1940. Registration as an investment adviser does not imply a certain level of skill or training. The oral and written communications of an adviser provide you with information about which you determine to hire or retain an adviser. Blue Ridge Wealth Planners Form ADV Part 2A & 2B can be obtained by going to www.adviserinfo.sec.gov. and searching the firms name. Neither the information nor any opinion expressed it so be construed as solicitation to buy or sell a security of personalized investment, tax, or legal advice.
Market Update: June 26 - 30, 2023

Weekly Summary
There was an overwhelming set of positive economic data last week that resulted in the 2-year increasing to just below 5% for the first time since March. The positive data helped stocks rally throughout the week despite the increase in interest rates, and the S&P 500 finished the first half of the year with a gain of 16.8%. It is now just 5% away from the all-time high set on January 3, 2022.
Economic Data
Durable goods orders kicked off the week and surprised to the upside. Orders grew by 1.7% in May compared to expectations of a 1% contraction. First quarter GDP also surprised to the upside with 2% growth. Potentially the best news of the week was in the Personal Consumption Expenditures release on Friday, which is the Federal Reserve’s preferred inflation measure. The PCE Price Index for May grew 3.8%, its lowest level since April 2021. We are now just 1.8% away from the Fed’s 2% inflation target.
Equities
The S&P 500 increased by 2.3% on the positive economic data released during the week and finished the second quarter with a total return of 8.7%. The narrative for the stock market was a bit different last week than it has been in recent memory. Over the past two years, it has seemed that strong economic news was bad for the stock market as it generally meant that the Federal Reserve would increase interest rates higher and faster than expected. Now that rates are very near the top of the Fed’s expected peak, it appears that the stock market is taking the good news as good news and is rallying when positive economic news is announced.
Fixed Income
Interest rates increased across the curve on the strong economic data releases. The curve remains very heavily inverted as markets expect at least two more interest rate increases in the short-term from the Federal Reserve, with the next increase coming this month. The 3-month interest rate is at 5.33%, which is 1.47% higher than the 10-year. The yield curve has now been inverted for fifteen months.
Commodities
The EIA announced last week that US total petroleum production hit an all-time high in April, which helps provide context to the continued price weakness in oil relative to a year ago. Russia, Venezuela, and Iran have all been under heavy sanctions from the US and Europe related to oil production, but this has not dampened their actual output and has instead rerouted the supplies to other countries, such as China. China’s demand forecast continues to increase as the country slowly reopens from three years of strong COVID lockdowns, and this demand has been met with additional supply primarily from Russia.
Interesting Articles
- CNBC: Key Fed inflation measure shows prices rose just 0.3% in May
- Ben Carlson: What Happened to the Recession?
- Nick Maggiulli: How to Spend More in Retirement
All data and figures in this article were collected from YCharts, Inc. on 07/03/2023 by Zach Hill of Blue Ridge Wealth Planners unless otherwise cited.
This material represents an assessment of the market and economic environment at a specific point in time and is not intended to be a forecast of future events, or a guarantee of future results. Forward-looking statements are subject to certain risks and uncertainties. Actual results, performance, or achievements may differ materially from those expressed or implied. Information is based on data gathered from what we believe are reliable sources. It is not guaranteed as to accuracy, does not purport to be complete and is not intended to be used as a primary basis for investment decisions. It should also not be construed as advice meeting the particular investment needs of any investor. Past performance does not guarantee future results.
Investments in emerging markets may be more volatile and less liquid than investing in developed markets and may involve exposure to economic structures that are generally less diverse and mature and to political systems which have less stability than those of more developed countries.
Investments in commodities may have greater volatility than investments in traditional securities, particularly if the instruments involve leverage. The value of commodity-linked derivative instruments may be affected by changes in overall market movements, commodity index volatility, changes in interest rates or factors affecting a particular industry or commodity, such as drought, floods, weather, livestock disease, embargoes, tariffs and international economic, political and regulatory developments. Use of leveraged commodity-linked derivatives creates an opportunity for increased return but, at the same time, creates the possibility for greater loss.
An index is an unmanaged portfolio of specific securities, the performance of which is often used as a benchmark in judging the relative performance of certain asset classes. Investors cannot invest directly in an index. An index does not charge management fees or brokerage expenses, and no such fees or expenses were deducted from the performance shown.
The Standard & Poor's 500 (S&P 500) is an unmanaged group of securities considered to be representative of the stock market in general. It is a market value weighted index with each stock's weight in the index proportionate to its market value.
The Financial Times Stock Exchange 100 Index, also called the FTSE 100 Index, FTSE 100, FTSE, or, informally, the "Footsie" is a share index of the 100 companies listed on the London Stock Exchange with the highest market capitalization. It is seen as a gauge of prosperity for businesses regulated by UK company law.
The FTSE Developed Europe Index is an index of European stocks, part of the FTSE Global Equity Index Series. It is a subset of the FTSE Europe Index. The FTSE Eurobloc Index is a subset of it.
The MSCI Emerging Markets Index is a float-adjusted market capitalization index that consists of indices in 21 emerging economies: Brazil, Chile, China, Colombia, Czech Republic, Egypt, Hungary, India, Indonesia, Korea, Malaysia, Mexico, Morocco, Peru, Philippines, Poland, Russia, South Africa, Taiwan, Thailand, and Turkey.
The Bloomberg Barclays US Aggregate Bond Index, or the Agg, is a broad base, market capitalization-weighted bond market index representing intermediate term investment grade bonds traded in the United States. Investors frequently use the index as a stand-in for measuring the performance of the US bond market.
The US Dollar Index (USDX, DXY) is an index (or measure) of the value of the United States dollar relative to a basket of foreign currencies, often referred to as a basket of US trade partners' currencies.
The Consumer Price Index (CPI) is a measure of inflation compiled by the US Bureau of Labor Studies.
West Texas Intermediate (WTI), also known as Texas light sweet, is a grade of crude oil used as a benchmark in oil pricing. This grade is described as light because of its relatively low density, and sweet because of its low sulfur content.
The Producer Price Index (PPI) is is a family of indexes that measures the average change over time in selling prices received by domestic producers of goods and services. PPIs measure price change from the perspective of the seller.
This report was prepared by Blue Ridge Wealth Planners, a federally registered investment adviser under the Investment Advisers Act of 1940. Registration as an investment adviser does not imply a certain level of skill or training. The oral and written communications of an adviser provide you with information about which you determine to hire or retain an adviser. Blue Ridge Wealth Planners Form ADV Part 2A & 2B can be obtained by going to www.adviserinfo.sec.gov. and searching the firms name. Neither the information nor any opinion expressed it so be construed as solicitation to buy or sell a security of personalized investment, tax, or legal advice.
Market Update: June 19 - 23, 2023

Weekly Summary
Last week was relatively quiet from an economic data and market event standpoint, with no major releases in either category. Absent any major headlines, global markets traded lower, and emerging markets led the way down nearly 5% on the week. Over the weekend, there was news from Russia of a potential coup against President Putin, which could have a major impact on commodity markets going forward. However, oil remains around the $70 mark for now.
Economic Data
There were no major economic releases last week in the US, but the UK did release its inflation report for May and it continues to be higher than expected. Inflation in May for the UK was 8.7%, which was the same level as April. Inflation in the UK peaked at 11.1% in October 2022 and has fallen 2.4% in the seven months since. US inflation peaked at 9.1% in June 2022 and fell by 2.7% in the seven months after its peak. The UK has lagged the US in both the peak and the recovery from high inflation, but it does appear to be on a similar trajectory downward for now.
Equities
The S&P 500 decreased by 1.7% in the week but enters the final week of Q2 up 14% in 2023. It is another light week for economic data releases, and earnings season for the second quarter is still about a month away. Second quarter earnings are expected to decline by 6.5%, which would be the largest decline in earnings since Q2 2020.
Fixed Income
Interest rates were flat on the week absent any major news, and the 2-year remains just below 5%. The yield curve has now been inverted for 16 months, and it will likely remain inverted for some time as the 10-year is still 1.02% below the 2-year. The 3-month interest rate is even higher than the 2-year at 5.33% as markets are currently expecting the Federal Reserve to increase interest rates two more times in 2023.
Commodities
Oil remains just below $70 a barrel despite significant turmoil in Russia over the weekend. There was an attempted coup in Russia by a Russian general, which marks the first challenge to Putin’s power from an attempted coup since 1993. The war in Ukraine has lasted significantly longer than many expected. While oil has been able to stabilize and is down roughly 37% from one year ago, it is still vulnerable to disruptions from Russia as Russia remains one of the largest oil producers in the world despite significant sanctions from the US and Europe.
Interesting Articles
- WSJ: What Oil Analysts Think About Russia's Weekend Rollercoaster
- Bloomberg: Putin Faces Historic Threat to Absolute Grip on Power in Russia
- CNBC: Brits are facing a major mortgage crisis as lending rates soar
All data and figures in this article were collected from YCharts, Inc. on 06/26/2023 by Zach Hill of Blue Ridge Wealth Planners unless otherwise cited.
This material represents an assessment of the market and economic environment at a specific point in time and is not intended to be a forecast of future events, or a guarantee of future results. Forward-looking statements are subject to certain risks and uncertainties. Actual results, performance, or achievements may differ materially from those expressed or implied. Information is based on data gathered from what we believe are reliable sources. It is not guaranteed as to accuracy, does not purport to be complete and is not intended to be used as a primary basis for investment decisions. It should also not be construed as advice meeting the particular investment needs of any investor. Past performance does not guarantee future results.
Investments in emerging markets may be more volatile and less liquid than investing in developed markets and may involve exposure to economic structures that are generally less diverse and mature and to political systems which have less stability than those of more developed countries.
Investments in commodities may have greater volatility than investments in traditional securities, particularly if the instruments involve leverage. The value of commodity-linked derivative instruments may be affected by changes in overall market movements, commodity index volatility, changes in interest rates or factors affecting a particular industry or commodity, such as drought, floods, weather, livestock disease, embargoes, tariffs and international economic, political and regulatory developments. Use of leveraged commodity-linked derivatives creates an opportunity for increased return but, at the same time, creates the possibility for greater loss.
An index is an unmanaged portfolio of specific securities, the performance of which is often used as a benchmark in judging the relative performance of certain asset classes. Investors cannot invest directly in an index. An index does not charge management fees or brokerage expenses, and no such fees or expenses were deducted from the performance shown.
The Standard & Poor's 500 (S&P 500) is an unmanaged group of securities considered to be representative of the stock market in general. It is a market value weighted index with each stock's weight in the index proportionate to its market value.
The Financial Times Stock Exchange 100 Index, also called the FTSE 100 Index, FTSE 100, FTSE, or, informally, the "Footsie" is a share index of the 100 companies listed on the London Stock Exchange with the highest market capitalization. It is seen as a gauge of prosperity for businesses regulated by UK company law.
The FTSE Developed Europe Index is an index of European stocks, part of the FTSE Global Equity Index Series. It is a subset of the FTSE Europe Index. The FTSE Eurobloc Index is a subset of it.
The MSCI Emerging Markets Index is a float-adjusted market capitalization index that consists of indices in 21 emerging economies: Brazil, Chile, China, Colombia, Czech Republic, Egypt, Hungary, India, Indonesia, Korea, Malaysia, Mexico, Morocco, Peru, Philippines, Poland, Russia, South Africa, Taiwan, Thailand, and Turkey.
The Bloomberg Barclays US Aggregate Bond Index, or the Agg, is a broad base, market capitalization-weighted bond market index representing intermediate term investment grade bonds traded in the United States. Investors frequently use the index as a stand-in for measuring the performance of the US bond market.
The US Dollar Index (USDX, DXY) is an index (or measure) of the value of the United States dollar relative to a basket of foreign currencies, often referred to as a basket of US trade partners' currencies.
The Consumer Price Index (CPI) is a measure of inflation compiled by the US Bureau of Labor Studies.
West Texas Intermediate (WTI), also known as Texas light sweet, is a grade of crude oil used as a benchmark in oil pricing. This grade is described as light because of its relatively low density, and sweet because of its low sulfur content.
The Producer Price Index (PPI) is is a family of indexes that measures the average change over time in selling prices received by domestic producers of goods and services. PPIs measure price change from the perspective of the seller.
This report was prepared by Blue Ridge Wealth Planners, a federally registered investment adviser under the Investment Advisers Act of 1940. Registration as an investment adviser does not imply a certain level of skill or training. The oral and written communications of an adviser provide you with information about which you determine to hire or retain an adviser. Blue Ridge Wealth Planners Form ADV Part 2A & 2B can be obtained by going to www.adviserinfo.sec.gov. and searching the firms name. Neither the information nor any opinion expressed it so be construed as solicitation to buy or sell a security of personalized investment, tax, or legal advice.
Market Update: June 12 - 16, 2023

Weekly Summary
The Federal Reserve elected to keep interest rates at 5% at their meeting on Wednesday. After some initial volatility following the announcement, stocks finished with their strongest week since March and are up nearly 8% in the second quarter. Interest rates have stayed relatively calm, and it appears that the brief banking crisis from earlier in the quarter has been resolved. All of these factors have led to an incredibly strong market, which is now up 25% since the October 2022 bottom.
Economic Data
Both consumer and producer price indices were released ahead of the Fed meeting on Wednesday, and both continue to show a significant deceleration in prices. CPI was 4% during May, its lowest level since March 2021, and PPI was just 1.1%. CPI has fallen for 11 straight months, while PPI has fallen for 14 straight months. Both inflation readings are incredibly positive, and economists believe there is only positive news ahead as well. Shelter, which makes up over a third of CPI’s weight, is expected to begin falling in the third quarter as it is known to be on a roughly 12–18-month lag compared to the rest of the index. If this holds true, there is a possibility that inflation is actually below 2% by the end of the year.
Equities
The S&P 500 increased by 2.6% last week and is now up 15.8% on the year. The market sentiment has been overwhelmingly positive, as earnings, inflation, and interest rates have all provided a boost to markets in the quarter.
Fixed Income
Interest rates have slowly climbed higher in the last few weeks. The 2-year reached a relative low of 3.73% on May 4 and is now 0.99% higher at 4.72% just over a month later. As the banking crisis fades further into the rear view mirror, interest rates have inched higher as the appetite for risk assets has increased. Also helping short-term rates was the dot-plot from the Fed’s Wednesday meeting, which shows they expect to increase interest rates two more times this year despite moderating inflation. It is a puzzling move from the Fed, which saw producer prices increase by just 1% in May, with consumer prices expected to continue dropping the rest of the year. But the Fed seems very determined to stop inflation, and does not seem to care what pain they may cause to the economy in their quest to do so.
Commodities
After a rambunctious 2022, commodities have been incredibly calm in 2023. Oil remains in the $70-range at $71.62 a barrel, and natural gas has only traded above $3 for one trading day since February.
Interesting Articles
- CNBC: Fed holds off on rate hike, but says two more are coming later this year
- WSJ: Why Inflation Around the World Just Won't Go Away
- Financial Times: ECB increases interest rates to highest level since 2001
All data and figures in this article were collected from YCharts, Inc. on 06/05/2023 by Zach Hill of Blue Ridge Wealth Planners unless otherwise cited.
This material represents an assessment of the market and economic environment at a specific point in time and is not intended to be a forecast of future events, or a guarantee of future results. Forward-looking statements are subject to certain risks and uncertainties. Actual results, performance, or achievements may differ materially from those expressed or implied. Information is based on data gathered from what we believe are reliable sources. It is not guaranteed as to accuracy, does not purport to be complete and is not intended to be used as a primary basis for investment decisions. It should also not be construed as advice meeting the particular investment needs of any investor. Past performance does not guarantee future results.
Investments in emerging markets may be more volatile and less liquid than investing in developed markets and may involve exposure to economic structures that are generally less diverse and mature and to political systems which have less stability than those of more developed countries.
Investments in commodities may have greater volatility than investments in traditional securities, particularly if the instruments involve leverage. The value of commodity-linked derivative instruments may be affected by changes in overall market movements, commodity index volatility, changes in interest rates or factors affecting a particular industry or commodity, such as drought, floods, weather, livestock disease, embargoes, tariffs and international economic, political and regulatory developments. Use of leveraged commodity-linked derivatives creates an opportunity for increased return but, at the same time, creates the possibility for greater loss.
An index is an unmanaged portfolio of specific securities, the performance of which is often used as a benchmark in judging the relative performance of certain asset classes. Investors cannot invest directly in an index. An index does not charge management fees or brokerage expenses, and no such fees or expenses were deducted from the performance shown.
The Standard & Poor's 500 (S&P 500) is an unmanaged group of securities considered to be representative of the stock market in general. It is a market value weighted index with each stock's weight in the index proportionate to its market value.
The Financial Times Stock Exchange 100 Index, also called the FTSE 100 Index, FTSE 100, FTSE, or, informally, the "Footsie" is a share index of the 100 companies listed on the London Stock Exchange with the highest market capitalization. It is seen as a gauge of prosperity for businesses regulated by UK company law.
The FTSE Developed Europe Index is an index of European stocks, part of the FTSE Global Equity Index Series. It is a subset of the FTSE Europe Index. The FTSE Eurobloc Index is a subset of it.
The MSCI Emerging Markets Index is a float-adjusted market capitalization index that consists of indices in 21 emerging economies: Brazil, Chile, China, Colombia, Czech Republic, Egypt, Hungary, India, Indonesia, Korea, Malaysia, Mexico, Morocco, Peru, Philippines, Poland, Russia, South Africa, Taiwan, Thailand, and Turkey.
The Bloomberg Barclays US Aggregate Bond Index, or the Agg, is a broad base, market capitalization-weighted bond market index representing intermediate term investment grade bonds traded in the United States. Investors frequently use the index as a stand-in for measuring the performance of the US bond market.
The US Dollar Index (USDX, DXY) is an index (or measure) of the value of the United States dollar relative to a basket of foreign currencies, often referred to as a basket of US trade partners' currencies.
The Consumer Price Index (CPI) is a measure of inflation compiled by the US Bureau of Labor Studies.
West Texas Intermediate (WTI), also known as Texas light sweet, is a grade of crude oil used as a benchmark in oil pricing. This grade is described as light because of its relatively low density, and sweet because of its low sulfur content.
The Producer Price Index (PPI) is is a family of indexes that measures the average change over time in selling prices received by domestic producers of goods and services. PPIs measure price change from the perspective of the seller.
This report was prepared by Blue Ridge Wealth Planners, a federally registered investment adviser under the Investment Advisers Act of 1940. Registration as an investment adviser does not imply a certain level of skill or training. The oral and written communications of an adviser provide you with information about which you determine to hire or retain an adviser. Blue Ridge Wealth Planners Form ADV Part 2A & 2B can be obtained by going to www.adviserinfo.sec.gov. and searching the firms name. Neither the information nor any opinion expressed it so be construed as solicitation to buy or sell a security of personalized investment, tax, or legal advice.
Market Update: May 29 - June 2, 2023

Weekly Summary
The May jobs report on Friday helped boost stocks to a weekly gain of over 3%, but interest rates remained relatively flat. Markets expect the Federal Reserve to pause their interest rate hikes in their June meeting, but increase by another 25 basis points in July. The labor market has been very resilient during this tightening cycle, which has given the Fed more confidence that they can continue their interest rate increases without impacting the overall economy.
Economic Data
The May jobs report was a goldilocks report for the stock market. Payrolls increased by 339,000, which was significantly higher than expectations of 190,000. At the same time, wage growth came in slightly lower than expectations, and the unemployment rate increased. If payrolls can grow while the unemployment rate increases, that typically means that more workers are entering the labor force. When this happens, it is interpreted as a positive sign because it means that workers believe the labor market is strong and they want to participate. When combined with lower than expected wage growth, this could be interpreted as one of the best employment reports that the market has seen during this tightening cycle.
Equities
The S&P 500 increased by 3.2% last week, led by a 1.5% gain on Friday to close out the week after the strong employment report. The S&P 500 is now up over 12% in 2023 and is now up 4.2% on a year-over-year basis. Despite the strong start to the year, it is still nearly 9% below the all-time highs set in January 2022. Small-caps outperformed large-caps last week, rising 4.4%.
Fixed Income
Interest rates were relatively unchanged last week despite the strong jobs report on Friday. The 2-year began the week by falling from 4.58% to 4.35%, but increased 21 basis points on Friday to finish the week at 4.56%. Markets have now assigned a 70% probability on another interest rate increase in July, as economic data continues to be stronger than expected.
Commodities
Oil began the week by dropping from about $73 a barrel to $67, which was its lowest level since the short-lived banking crisis in March. However, news that Saudi Arabia is planning another production cut boosted the price and oil is now trading above $73, a nearly 10% increase from the lows last week. The price does remain significantly lower than a year ago, when oil was trading at $119 a barrel at the beginning of the 2022 summer travel season.
Interesting Articles
- CNBC: Payrolls rose 339,000 in May, much better than expected
- WSJ: Why Your Steak Is Getting Pricier
- Bloomberg: Oil Rises on Saudi Arabia's Go-It-Alone July Production Cuts
All data and figures in this article were collected from YCharts, Inc. on 06/05/2023 by Zach Hill of Blue Ridge Wealth Planners unless otherwise cited.
This material represents an assessment of the market and economic environment at a specific point in time and is not intended to be a forecast of future events, or a guarantee of future results. Forward-looking statements are subject to certain risks and uncertainties. Actual results, performance, or achievements may differ materially from those expressed or implied. Information is based on data gathered from what we believe are reliable sources. It is not guaranteed as to accuracy, does not purport to be complete and is not intended to be used as a primary basis for investment decisions. It should also not be construed as advice meeting the particular investment needs of any investor. Past performance does not guarantee future results.
Investments in emerging markets may be more volatile and less liquid than investing in developed markets and may involve exposure to economic structures that are generally less diverse and mature and to political systems which have less stability than those of more developed countries.
The performance figures shown are gross of investment advisory fees and other expenses. The deduction of these management fees and expenses would reduce the overall return. Because fees are deducted quarterly, the compounding effect would be to increase the impact of the fee deduction on gross account performance by a greater percentage than that of the annual fee charged. For example, if an account is charged a 1% management fee per year and has gross performance of 12% during that same period, the compounding effect of the quarterly fee assessments will result in an actual return of approximately 10.9%.
Investments in commodities may have greater volatility than investments in traditional securities, particularly if the instruments involve leverage. The value of commodity-linked derivative instruments may be affected by changes in overall market movements, commodity index volatility, changes in interest rates or factors affecting a particular industry or commodity, such as drought, floods, weather, livestock disease, embargoes, tariffs and international economic, political and regulatory developments. Use of leveraged commodity-linked derivatives creates an opportunity for increased return but, at the same time, creates the possibility for greater loss.
Indices are unmanaged and investors cannot invest directly in an index. Unless otherwise noted, performance of indices does not account for any fees, commissions or other expenses that would be incurred. Returns do not include reinvested dividends.
The Standard & Poor's 500 (S&P 500) is an unmanaged group of securities considered to be representative of the stock market in general. It is a market value weighted index with each stock's weight in the index proportionate to its market value.
The Financial Times Stock Exchange 100 Index, also called the FTSE 100 Index, FTSE 100, FTSE, or, informally, the "Footsie" is a share index of the 100 companies listed on the London Stock Exchange with the highest market capitalization. It is seen as a gauge of prosperity for businesses regulated by UK company law.
The FTSE Developed Europe Index is an index of European stocks, part of the FTSE Global Equity Index Series. It is a subset of the FTSE Europe Index. The FTSE Eurobloc Index is a subset of it.
The MSCI Emerging Markets Index is a float-adjusted market capitalization index that consists of indices in 21 emerging economies: Brazil, Chile, China, Colombia, Czech Republic, Egypt, Hungary, India, Indonesia, Korea, Malaysia, Mexico, Morocco, Peru, Philippines, Poland, Russia, South Africa, Taiwan, Thailand, and Turkey.
The Bloomberg Barclays US Aggregate Bond Index, or the Agg, is a broad base, market capitalization-weighted bond market index representing intermediate term investment grade bonds traded in the United States. Investors frequently use the index as a stand-in for measuring the performance of the US bond market.
The US Dollar Index (USDX, DXY) is an index (or measure) of the value of the United States dollar relative to a basket of foreign currencies, often referred to as a basket of US trade partners' currencies.
The Consumer Price Index (CPI) is a measure of inflation compiled by the US Bureau of Labor Studies.
West Texas Intermediate (WTI), also known as Texas light sweet, is a grade of crude oil used as a benchmark in oil pricing. This grade is described as light because of its relatively low density, and sweet because of its low sulfur content.
The Producer Price Index (PPI) is is a family of indexes that measures the average change over time in selling prices received by domestic producers of goods and services. PPIs measure price change from the perspective of the seller.
This report was prepared by Blue Ridge Wealth Planners, a federally registered investment adviser under the Investment Advisers Act of 1940. Registration as an investment adviser does not imply a certain level of skill or training. The oral and written communications of an adviser provide you with information about which you determine to hire or retain an adviser. Blue Ridge Wealth Planners Form ADV Part 2A & 2B can be obtained by going to www.adviserinfo.sec.gov. and searching the firms name. Neither the information nor any opinion expressed it so be construed as solicitation to buy or sell a security of personalized investment, tax, or legal advice.
Market Update: May 15 - 19, 2023

Weekly Summary
Stocks rallied to nearly 10% year-to-date gains last week as regional banks led the charge with a 7.7% gain. Western Alliance Bancorp announced that deposits have grown by more than $2 billion since the end of the first quarter, marking a sharp turnaround from the regional bank deposit decline in March. The regional bank rally was aided by Federal Reserve Chair Jerome Powell on Friday, who said that he believed that interest rates may not have to rise much more to tame inflation. This was another sign that the Fed might be done raising rates for the time being.
Economic Data
It was a light week in economic data last week. Retail sales for April sharply missed expectations with a moderate 0.4% month-over-month expansion, while the March number was revised much lower to a 0.7% contraction. Despite this weakness, the Atlanta Fed’s GDPNow tracker for the second quarter is currently expecting a very robust 2.9% growth.
Equities
The S&P 500 increased by 1.7% last week, but small-caps still underperformed with a 1.6% gain on the week despite a nearly 8% rally in regional banks. First quarter earnings releases have been better than expected, and upside revenue surprises are above their 10-year average. This shows that despite seemingly negative sentiment in the markets going into the quarter, companies performed very well and these earnings have helped propel the stock market to a 9.9% YTD gain. Stocks are now up 9.2% on a one-year basis.
Fixed Income
Interest rates increased last week as the risk-on sentiment returned to markets, which stocks gaining and bonds losing. The increase in interest rates can be interpreted as a good thing for the overall health of the market. Interest rates decreased substantially following the initial shock of the banking crisis, as markets began to price in a potential financial crisis as a result of the banking turmoil. Now that it appears the banking crisis is over for the time being, stocks have rallied and interest rates have increased.
Interesting Articles
- CNBC: Fed Chari Powell says rates may not have to rise as much as expected
- Bloomberg: Regional Bank Stocks Bounce for Strongest Rally in Two Years
- Ben Carlson: What's the Best Long-Term Investment?
All data and figures in this article were collected from YCharts, Inc. on 05/22/2023 by Zach Hill of Blue Ridge Wealth Planners unless otherwise cited.
This material represents an assessment of the market and economic environment at a specific point in time and is not intended to be a forecast of future events, or a guarantee of future results. Forward-looking statements are subject to certain risks and uncertainties. Actual results, performance, or achievements may differ materially from those expressed or implied. Information is based on data gathered from what we believe are reliable sources. It is not guaranteed as to accuracy, does not purport to be complete and is not intended to be used as a primary basis for investment decisions. It should also not be construed as advice meeting the particular investment needs of any investor. Past performance does not guarantee future results.
Investments in emerging markets may be more volatile and less liquid than investing in developed markets and may involve exposure to economic structures that are generally less diverse and mature and to political systems which have less stability than those of more developed countries.
The performance figures shown are gross of investment advisory fees and other expenses. The deduction of these management fees and expenses would reduce the overall return. Because fees are deducted quarterly, the compounding effect would be to increase the impact of the fee deduction on gross account performance by a greater percentage than that of the annual fee charged. For example, if an account is charged a 1% management fee per year and has gross performance of 12% during that same period, the compounding effect of the quarterly fee assessments will result in an actual return of approximately 10.9%.
Investments in commodities may have greater volatility than investments in traditional securities, particularly if the instruments involve leverage. The value of commodity-linked derivative instruments may be affected by changes in overall market movements, commodity index volatility, changes in interest rates or factors affecting a particular industry or commodity, such as drought, floods, weather, livestock disease, embargoes, tariffs and international economic, political and regulatory developments. Use of leveraged commodity-linked derivatives creates an opportunity for increased return but, at the same time, creates the possibility for greater loss.
Indices are unmanaged and investors cannot invest directly in an index. Unless otherwise noted, performance of indices does not account for any fees, commissions or other expenses that would be incurred. Returns do not include reinvested dividends.
The Standard & Poor's 500 (S&P 500) is an unmanaged group of securities considered to be representative of the stock market in general. It is a market value weighted index with each stock's weight in the index proportionate to its market value.
The Financial Times Stock Exchange 100 Index, also called the FTSE 100 Index, FTSE 100, FTSE, or, informally, the "Footsie" is a share index of the 100 companies listed on the London Stock Exchange with the highest market capitalization. It is seen as a gauge of prosperity for businesses regulated by UK company law.
The FTSE Developed Europe Index is an index of European stocks, part of the FTSE Global Equity Index Series. It is a subset of the FTSE Europe Index. The FTSE Eurobloc Index is a subset of it.
The MSCI Emerging Markets Index is a float-adjusted market capitalization index that consists of indices in 21 emerging economies: Brazil, Chile, China, Colombia, Czech Republic, Egypt, Hungary, India, Indonesia, Korea, Malaysia, Mexico, Morocco, Peru, Philippines, Poland, Russia, South Africa, Taiwan, Thailand, and Turkey.
The Bloomberg Barclays US Aggregate Bond Index, or the Agg, is a broad base, market capitalization-weighted bond market index representing intermediate term investment grade bonds traded in the United States. Investors frequently use the index as a stand-in for measuring the performance of the US bond market.
The US Dollar Index (USDX, DXY) is an index (or measure) of the value of the United States dollar relative to a basket of foreign currencies, often referred to as a basket of US trade partners' currencies.
The Consumer Price Index (CPI) is a measure of inflation compiled by the US Bureau of Labor Studies.
West Texas Intermediate (WTI), also known as Texas light sweet, is a grade of crude oil used as a benchmark in oil pricing. This grade is described as light because of its relatively low density, and sweet because of its low sulfur content.
The Producer Price Index (PPI) is is a family of indexes that measures the average change over time in selling prices received by domestic producers of goods and services. PPIs measure price change from the perspective of the seller.
This report was prepared by Blue Ridge Wealth Planners, a federally registered investment adviser under the Investment Advisers Act of 1940. Registration as an investment adviser does not imply a certain level of skill or training. The oral and written communications of an adviser provide you with information about which you determine to hire or retain an adviser. Blue Ridge Wealth Planners Form ADV Part 2A & 2B can be obtained by going to www.adviserinfo.sec.gov. and searching the firms name. Neither the information nor any opinion expressed it so be construed as solicitation to buy or sell a security of personalized investment, tax, or legal advice.
Market Update: May 8 - 12, 2023

Weekly Summary
Stocks continued their recent downward slide last week despite better-than-expected inflation data. The banking crisis remains the focal point for markets, as regional banks dropped by another 7% last week and are now down 38% in 2023.
Economic Data
The April inflation report was slightly better than expected but was seen as a sigh of relief for markets following the very strong jobs report. Inflation stood at 4.9% for the month, marking the second consecutive month below 5%. More importantly, the focus now shifts to June's inflation data, as economists anticipate that the shelter component of the Consumer Price Index (CPI) will start significantly impacting the headline number.
Equities
After a 6.5% rally from March 10 to March 31, stocks have only gained 0.5% since the beginning of the second quarter due to the persistent banking crisis. While there haven't been any major developments in the banking sector, traders continue to scrutinize data in an attempt to identify the next bank at risk. This concern has primarily affected small-cap stocks, which are now down 0.6% for the year, compared to an 8% gain for the S&P 500.
Fixed Income
Similar to stocks, interest rates have remained within a relatively tight range as economic data has generally met expectations, and the Federal Reserve seems to have halted interest rate tightening for now. The relatively calm bond market provides a welcome respite from the extreme volatility witnessed over the past two years, with the two-year rate holding steady near 4% for most of the last two months.
Commodities
Oil prices have remained subdued at $70 per barrel as demand data has surprisingly weakened during what is typically the start of the summer travel season. Inventories at Cushing, Oklahoma, a crucial storage facility for WTI Crude, have significantly increased in 2023, contributing to price stability within the $70-80 range for most of this year.
Interesting Articles
- CNBC: Inflation rate eases to 4.9% in April, less than expectations
- WSJ: The Decline of the Five-Day Commute Is a Boon to Suburban Retail
- FT: Federal Reserve warns of credit crunch risk after US bank turmoil
All data and figures in this article were collected from YCharts, Inc. on 05/15/2023 by Zach Hill of Blue Ridge Wealth Planners unless otherwise cited.
This material represents an assessment of the market and economic environment at a specific point in time and is not intended to be a forecast of future events, or a guarantee of future results. Forward-looking statements are subject to certain risks and uncertainties. Actual results, performance, or achievements may differ materially from those expressed or implied. Information is based on data gathered from what we believe are reliable sources. It is not guaranteed as to accuracy, does not purport to be complete and is not intended to be used as a primary basis for investment decisions. It should also not be construed as advice meeting the particular investment needs of any investor. Past performance does not guarantee future results.
Investments in emerging markets may be more volatile and less liquid than investing in developed markets and may involve exposure to economic structures that are generally less diverse and mature and to political systems which have less stability than those of more developed countries.
The performance figures shown are gross of investment advisory fees and other expenses. The deduction of these management fees and expenses would reduce the overall return. Because fees are deducted quarterly, the compounding effect would be to increase the impact of the fee deduction on gross account performance by a greater percentage than that of the annual fee charged. For example, if an account is charged a 1% management fee per year and has gross performance of 12% during that same period, the compounding effect of the quarterly fee assessments will result in an actual return of approximately 10.9%.
Investments in commodities may have greater volatility than investments in traditional securities, particularly if the instruments involve leverage. The value of commodity-linked derivative instruments may be affected by changes in overall market movements, commodity index volatility, changes in interest rates or factors affecting a particular industry or commodity, such as drought, floods, weather, livestock disease, embargoes, tariffs and international economic, political and regulatory developments. Use of leveraged commodity-linked derivatives creates an opportunity for increased return but, at the same time, creates the possibility for greater loss.
Indices are unmanaged and investors cannot invest directly in an index. Unless otherwise noted, performance of indices does not account for any fees, commissions or other expenses that would be incurred. Returns do not include reinvested dividends.
The Standard & Poor's 500 (S&P 500) is an unmanaged group of securities considered to be representative of the stock market in general. It is a market value weighted index with each stock's weight in the index proportionate to its market value.
The Financial Times Stock Exchange 100 Index, also called the FTSE 100 Index, FTSE 100, FTSE, or, informally, the "Footsie" is a share index of the 100 companies listed on the London Stock Exchange with the highest market capitalization. It is seen as a gauge of prosperity for businesses regulated by UK company law.
The FTSE Developed Europe Index is an index of European stocks, part of the FTSE Global Equity Index Series. It is a subset of the FTSE Europe Index. The FTSE Eurobloc Index is a subset of it.
The MSCI Emerging Markets Index is a float-adjusted market capitalization index that consists of indices in 21 emerging economies: Brazil, Chile, China, Colombia, Czech Republic, Egypt, Hungary, India, Indonesia, Korea, Malaysia, Mexico, Morocco, Peru, Philippines, Poland, Russia, South Africa, Taiwan, Thailand, and Turkey.
The Bloomberg Barclays US Aggregate Bond Index, or the Agg, is a broad base, market capitalization-weighted bond market index representing intermediate term investment grade bonds traded in the United States. Investors frequently use the index as a stand-in for measuring the performance of the US bond market.
The US Dollar Index (USDX, DXY) is an index (or measure) of the value of the United States dollar relative to a basket of foreign currencies, often referred to as a basket of US trade partners' currencies.
The Consumer Price Index (CPI) is a measure of inflation compiled by the US Bureau of Labor Studies.
West Texas Intermediate (WTI), also known as Texas light sweet, is a grade of crude oil used as a benchmark in oil pricing. This grade is described as light because of its relatively low density, and sweet because of its low sulfur content.
The Producer Price Index (PPI) is is a family of indexes that measures the average change over time in selling prices received by domestic producers of goods and services. PPIs measure price change from the perspective of the seller.
Market Update: April 17 - 21, 2023

Weekly Summary
With no major economic data releases last week, markets were relatively quiet last week as we await the next Federal Reserve meeting on May 3. The first quarter earnings season is underway for stocks, and the results have been mixed so far, contributing to the modest 0.69% return in Q2 2023. Interest rates have slightly increased, but the focus has shifted back to the Fed and the economy ahead of next week’s anticipated interest rate increase.
Economic Data
Last week was relatively quiet regarding economic data. Housing starts were in-line with expectations, and existing home sales and building permits were slightly lower than expected. First quarter GDP is still expected to grow by 2.5%.
Equities
The S&P 500 was flat last week, as the market shifted its focus to earnings season. While 76% of S&P 500 companies have reported positive earnings surprises, the overall growth rate is showing a 6.2% contraction in earnings. Compared to the expected 6.7% contraction, this is relatively good news, but a contraction is still a contraction. The net profit margin for the S&P 500 also contracted again during the quarter, which marks its seventh straight quarterly decline as higher costs continue to eat into the margins of companies across the country.
Fixed Income
Interest rates were slightly higher across most of the curve, but the 3-month yield remains significantly higher than any other interest rate maturity on the Treasury curve. The 3-month yield is currently at 5.20%. When the 3-month yield is so much higher than the 2-year yield (currently a 1.05% inversion) it means that the market expects the Federal Reserve to cut rates sometime within the next two years. Markets are currently expecting the Fed to hike one more time, and then begin cutting later this year after inflation moderates. Meanwhile, the Fed has rebuffed this notion and maintains its intent to keep interest rates higher for longer to combat inflation. The current 2-year to 3-month inversion means that the market is attempting to call the Fed’s bluff and currently believes the Fed will not be able to hold to their current plan.
Commodities
Oil ticked below $80 a barrel last week, ending the short-lived price bump seen after OPEC announced its surprise cut a few weeks ago. When OPEC tends to announce surprise production cuts, prices do initially increase but then moderate over the weeks after as OPEC very rarely actually cuts as much as they actually do.
Interesting Articles
- FT: Five takeaways from China's first-quarter GDP data
- Bloomberg Opinion: Get Ready for Lower Fuel Prices - and Slower Inflation
- Bloomberg: Investors Are the Most Bearish on Stocks Versus Bonds Since 2009
All data and figures in this article were collected from YCharts, Inc. on 04/24/2023 by Zach Hill of Blue Ridge Wealth Planners unless otherwise cited.
This material represents an assessment of the market and economic environment at a specific point in time and is not intended to be a forecast of future events, or a guarantee of future results. Forward-looking statements are subject to certain risks and uncertainties. Actual results, performance, or achievements may differ materially from those expressed or implied. Information is based on data gathered from what we believe are reliable sources. It is not guaranteed as to accuracy, does not purport to be complete and is not intended to be used as a primary basis for investment decisions. It should also not be construed as advice meeting the particular investment needs of any investor. Past performance does not guarantee future results.
Investments in emerging markets may be more volatile and less liquid than investing in developed markets and may involve exposure to economic structures that are generally less diverse and mature and to political systems which have less stability than those of more developed countries.
The performance figures shown are gross of investment advisory fees and other expenses. The deduction of these management fees and expenses would reduce the overall return. Because fees are deducted quarterly, the compounding effect would be to increase the impact of the fee deduction on gross account performance by a greater percentage than that of the annual fee charged. For example, if an account is charged a 1% management fee per year and has gross performance of 12% during that same period, the compounding effect of the quarterly fee assessments will result in an actual return of approximately 10.9%.
Investments in commodities may have greater volatility than investments in traditional securities, particularly if the instruments involve leverage. The value of commodity-linked derivative instruments may be affected by changes in overall market movements, commodity index volatility, changes in interest rates or factors affecting a particular industry or commodity, such as drought, floods, weather, livestock disease, embargoes, tariffs and international economic, political and regulatory developments. Use of leveraged commodity-linked derivatives creates an opportunity for increased return but, at the same time, creates the possibility for greater loss.
Indices are unmanaged and investors cannot invest directly in an index. Unless otherwise noted, performance of indices does not account for any fees, commissions or other expenses that would be incurred. Returns do not include reinvested dividends.
The Standard & Poor's 500 (S&P 500) is an unmanaged group of securities considered to be representative of the stock market in general. It is a market value weighted index with each stock's weight in the index proportionate to its market value.
The Financial Times Stock Exchange 100 Index, also called the FTSE 100 Index, FTSE 100, FTSE, or, informally, the "Footsie" is a share index of the 100 companies listed on the London Stock Exchange with the highest market capitalization. It is seen as a gauge of prosperity for businesses regulated by UK company law.
The FTSE Developed Europe Index is an index of European stocks, part of the FTSE Global Equity Index Series. It is a subset of the FTSE Europe Index. The FTSE Eurobloc Index is a subset of it.
The MSCI Emerging Markets Index is a float-adjusted market capitalization index that consists of indices in 21 emerging economies: Brazil, Chile, China, Colombia, Czech Republic, Egypt, Hungary, India, Indonesia, Korea, Malaysia, Mexico, Morocco, Peru, Philippines, Poland, Russia, South Africa, Taiwan, Thailand, and Turkey.
The Bloomberg Barclays US Aggregate Bond Index, or the Agg, is a broad base, market capitalization-weighted bond market index representing intermediate term investment grade bonds traded in the United States. Investors frequently use the index as a stand-in for measuring the performance of the US bond market.
The US Dollar Index (USDX, DXY) is an index (or measure) of the value of the United States dollar relative to a basket of foreign currencies, often referred to as a basket of US trade partners' currencies.
The Consumer Price Index (CPI) is a measure of inflation compiled by the US Bureau of Labor Studies.
West Texas Intermediate (WTI), also known as Texas light sweet, is a grade of crude oil used as a benchmark in oil pricing. This grade is described as light because of its relatively low density, and sweet because of its low sulfur content.
The Producer Price Index (PPI) is is a family of indexes that measures the average change over time in selling prices received by domestic producers of goods and services. PPIs measure price change from the perspective of the seller.
Market Update: April 10 - 14, 2023

Weekly Summary
Markets continued to rally last week, and the S&P 500 is now up 16.7% since it’s October 2022 low. There were two inflation reports that were overwhelmingly positive and first quarter GDP is expected to come in at a relatively strong 2.5% in the first quarter. A strong economy and moderating inflation has now put a soft-landing for the Fed back on the table as it expects to hike rates just one more time in 2023.
Economic Data
The March CPI report was lower than expected at 4.98% year-over-year and was the lowest CPI reading since May 2021. The closely watched month-over-month figure was just 0.1%, which is a sharp decline from the 0.4% MoM reading in February. This report was complemented by a shocking decline in the producer price index, as it decreased by 0.5% in the month. PPI is often seen as a leading indicator to CPI, so this news combined with CPI was incredibly positive.
Equities
The S&P 500 was up 0.80% and is now up 8.27% in 2023. Despite the March banking woes, markets have been able to rally off strong economic data, decelerating inflation data, and the expectation that the Fed will pause its interest rate increases after just one more increase in May 2023. Earnings for the S&P 500 are expected to contract by 6.5% in the quarter, which would be the largest decline for earnings since Q2 2020. This is largely due to margin compression because of increasing costs on companies. Unlike 2021, which saw companies passing on higher costs to consumers, companies are now internalizing the cost increases and taking them on in the form of margin compression instead of passing them onto consumers.
Fixed Income
Interest rates initially ticked lower after the downside inflation surprise, but then increased slightly as markets internalized the near certainty of the Federal Reserve increasing interest rates again at their meeting in two weeks. Barring an unforeseen increase in the inflation rate, it is expected that this will be the last rate increase of this extremely fast tightening cycle as the Fed expects to hold rates above 5% for the time being to let the impact of those higher rates permeate throughout the economy.
Commodities
Oil remains slightly above $80 a barrel after the surprise OPEC cut, but gasoline prices have continued to increase. Gasoline prices are still down about 41 cents a gallon from this time last year, but demand has significantly increased in recent weeks despite the price of oil increasing as well. As demand continues to ramp up for the summer travel season, prices could remain elevated relative to a few months ago.
Interesting Articles
- WSJ: Construction Industry Has Work, Needs More Workers
- CNBC: Here's the inflation breakdown for March 2023
- Bloomberg: Bond Market is Overplaying the Risk of a Deep Recession
All data and figures in this article were collected from YCharts, Inc. on 04/17/2023 by Zach Hill of Blue Ridge Wealth Planners unless otherwise cited.
This material represents an assessment of the market and economic environment at a specific point in time and is not intended to be a forecast of future events, or a guarantee of future results. Forward-looking statements are subject to certain risks and uncertainties. Actual results, performance, or achievements may differ materially from those expressed or implied. Information is based on data gathered from what we believe are reliable sources. It is not guaranteed as to accuracy, does not purport to be complete and is not intended to be used as a primary basis for investment decisions. It should also not be construed as advice meeting the particular investment needs of any investor. Past performance does not guarantee future results.
Investments in emerging markets may be more volatile and less liquid than investing in developed markets and may involve exposure to economic structures that are generally less diverse and mature and to political systems which have less stability than those of more developed countries.
The performance figures shown are gross of investment advisory fees and other expenses. The deduction of these management fees and expenses would reduce the overall return. Because fees are deducted quarterly, the compounding effect would be to increase the impact of the fee deduction on gross account performance by a greater percentage than that of the annual fee charged. For example, if an account is charged a 1% management fee per year and has gross performance of 12% during that same period, the compounding effect of the quarterly fee assessments will result in an actual return of approximately 10.9%.
Investments in commodities may have greater volatility than investments in traditional securities, particularly if the instruments involve leverage. The value of commodity-linked derivative instruments may be affected by changes in overall market movements, commodity index volatility, changes in interest rates or factors affecting a particular industry or commodity, such as drought, floods, weather, livestock disease, embargoes, tariffs and international economic, political and regulatory developments. Use of leveraged commodity-linked derivatives creates an opportunity for increased return but, at the same time, creates the possibility for greater loss.
Indices are unmanaged and investors cannot invest directly in an index. Unless otherwise noted, performance of indices does not account for any fees, commissions or other expenses that would be incurred. Returns do not include reinvested dividends.
The Standard & Poor's 500 (S&P 500) is an unmanaged group of securities considered to be representative of the stock market in general. It is a market value weighted index with each stock's weight in the index proportionate to its market value.
The Financial Times Stock Exchange 100 Index, also called the FTSE 100 Index, FTSE 100, FTSE, or, informally, the "Footsie" is a share index of the 100 companies listed on the London Stock Exchange with the highest market capitalization. It is seen as a gauge of prosperity for businesses regulated by UK company law.
The FTSE Developed Europe Index is an index of European stocks, part of the FTSE Global Equity Index Series. It is a subset of the FTSE Europe Index. The FTSE Eurobloc Index is a subset of it.
The MSCI Emerging Markets Index is a float-adjusted market capitalization index that consists of indices in 21 emerging economies: Brazil, Chile, China, Colombia, Czech Republic, Egypt, Hungary, India, Indonesia, Korea, Malaysia, Mexico, Morocco, Peru, Philippines, Poland, Russia, South Africa, Taiwan, Thailand, and Turkey.
The Bloomberg Barclays US Aggregate Bond Index, or the Agg, is a broad base, market capitalization-weighted bond market index representing intermediate term investment grade bonds traded in the United States. Investors frequently use the index as a stand-in for measuring the performance of the US bond market.
The US Dollar Index (USDX, DXY) is an index (or measure) of the value of the United States dollar relative to a basket of foreign currencies, often referred to as a basket of US trade partners' currencies.
The Consumer Price Index (CPI) is a measure of inflation compiled by the US Bureau of Labor Studies.
West Texas Intermediate (WTI), also known as Texas light sweet, is a grade of crude oil used as a benchmark in oil pricing. This grade is described as light because of its relatively low density, and sweet because of its low sulfur content.
The Producer Price Index (PPI) is is a family of indexes that measures the average change over time in selling prices received by domestic producers of goods and services. PPIs measure price change from the perspective of the seller.
Market Update: April 3 - 7, 2023

Weekly Summary
Markets were relatively calm across the board last week, partially due to the Good Friday holiday on Friday coinciding with the release of the March jobs report. The jobs report was also uneventful, as it was largely in line with expectations. There are some significant events on the horizon as the March inflation report will be released on Wednesday, and S&P 500 earnings season for the first quarter begins later this week.
Economic Data
The March employment report was in line with economist expectations. The headline payrolls number grew by 236,000 in the month compared with 239,000 expected, while the unemployment rate actually decreased to 3.5% despite a higher labor force participation rate. The overall release is strong, but the headline payrolls number is the weakest in over a year and is sure to be a welcome sign for the Federal Reserve as it signals that hiring might finally be cooling off.
Equities
The S&P 500 was flat last week and the stock market was closed on Friday for the Good Friday holiday, so there were no knee-jerk reactions to the employment data. The focus will be on the first quarter earnings season, which begins later this week. For Q1 2023, earnings are expected to decline by 6.6%, which would be the largest earnings decline since the initial COVID-19 shock in Q2 2022.
Fixed Income
Interest rates remain relatively subdued across the board, and the Federal Reserve does not meet again until May 3. The March employment report and Wednesday’s CPI report are the last two key economic releases before the Fed meets in three weeks, and markets are currently split on whether the Fed will hike again or choose to finally pause interest rate increases.
Commodities
Oil remains slightly above $80 a barrel after the surprise OPEC cut last week, but natural gas has consistently gone down and is now close to breaking a key $2 resistance level. If natural gas were to fall below $2, it would be its first time below $2 since the initial COVID-19 drawdown in early 2020.
Interesting Articles
- FT: US regional banks reduced cash buffers ahead of run on deposits
- Ben Carlson: The Good & Bad of Investing in the Stock Market
- Bloomberg: What's Next for Oil After Surprise OPEC Cuts? Try $100 a Barrel
All data and figures in this article were collected from YCharts, Inc. on 04/10/2023 by Zach Hill of Blue Ridge Wealth Planners unless otherwise cited.
This material represents an assessment of the market and economic environment at a specific point in time and is not intended to be a forecast of future events, or a guarantee of future results. Forward-looking statements are subject to certain risks and uncertainties. Actual results, performance, or achievements may differ materially from those expressed or implied. Information is based on data gathered from what we believe are reliable sources. It is not guaranteed as to accuracy, does not purport to be complete and is not intended to be used as a primary basis for investment decisions. It should also not be construed as advice meeting the particular investment needs of any investor. Past performance does not guarantee future results.
Investments in emerging markets may be more volatile and less liquid than investing in developed markets and may involve exposure to economic structures that are generally less diverse and mature and to political systems which have less stability than those of more developed countries.
The performance figures shown are gross of investment advisory fees and other expenses. The deduction of these management fees and expenses would reduce the overall return. Because fees are deducted quarterly, the compounding effect would be to increase the impact of the fee deduction on gross account performance by a greater percentage than that of the annual fee charged. For example, if an account is charged a 1% management fee per year and has gross performance of 12% during that same period, the compounding effect of the quarterly fee assessments will result in an actual return of approximately 10.9%.
Investments in commodities may have greater volatility than investments in traditional securities, particularly if the instruments involve leverage. The value of commodity-linked derivative instruments may be affected by changes in overall market movements, commodity index volatility, changes in interest rates or factors affecting a particular industry or commodity, such as drought, floods, weather, livestock disease, embargoes, tariffs and international economic, political and regulatory developments. Use of leveraged commodity-linked derivatives creates an opportunity for increased return but, at the same time, creates the possibility for greater loss.
Indices are unmanaged and investors cannot invest directly in an index. Unless otherwise noted, performance of indices does not account for any fees, commissions or other expenses that would be incurred. Returns do not include reinvested dividends.
The Standard & Poor's 500 (S&P 500) is an unmanaged group of securities considered to be representative of the stock market in general. It is a market value weighted index with each stock's weight in the index proportionate to its market value.
The Financial Times Stock Exchange 100 Index, also called the FTSE 100 Index, FTSE 100, FTSE, or, informally, the "Footsie" is a share index of the 100 companies listed on the London Stock Exchange with the highest market capitalization. It is seen as a gauge of prosperity for businesses regulated by UK company law.
The FTSE Developed Europe Index is an index of European stocks, part of the FTSE Global Equity Index Series. It is a subset of the FTSE Europe Index. The FTSE Eurobloc Index is a subset of it.
The MSCI Emerging Markets Index is a float-adjusted market capitalization index that consists of indices in 21 emerging economies: Brazil, Chile, China, Colombia, Czech Republic, Egypt, Hungary, India, Indonesia, Korea, Malaysia, Mexico, Morocco, Peru, Philippines, Poland, Russia, South Africa, Taiwan, Thailand, and Turkey.
The Bloomberg Barclays US Aggregate Bond Index, or the Agg, is a broad base, market capitalization-weighted bond market index representing intermediate term investment grade bonds traded in the United States. Investors frequently use the index as a stand-in for measuring the performance of the US bond market.
The US Dollar Index (USDX, DXY) is an index (or measure) of the value of the United States dollar relative to a basket of foreign currencies, often referred to as a basket of US trade partners' currencies.
The Consumer Price Index (CPI) is a measure of inflation compiled by the US Bureau of Labor Studies.
West Texas Intermediate (WTI), also known as Texas light sweet, is a grade of crude oil used as a benchmark in oil pricing. This grade is described as light because of its relatively low density, and sweet because of its low sulfur content.
The Producer Price Index (PPI) is is a family of indexes that measures the average change over time in selling prices received by domestic producers of goods and services. PPIs measure price change from the perspective of the seller.
Market Update: March 27 - 31, 2023

Weekly Summary
Stock markets increased over 3% last week to end with a 7.5% return for the first quarter of 2023. The return number itself is quite surprising when you consider everything that happened during the first three months of the year. The year started off relatively quiet, but the news cycle quickly ramped up with higher than expected inflation in February followed by the Silicon Valley Bank failure. Despite these significant headwinds, stocks rallied and interest rates remained relatively subdued during the quarter to round out what ends up being one of the best quarterly returns for the stock market in recent history.
Economic Data
European inflation continues to surprise to the upside and remains stubbornly high, especially when compared to inflation in the United States. Germany’s preliminary March inflation rate was 7.4% year-over-year and 0.8% month-over-month, both of which were higher than estimates. Contrast this reading to the February PCE for the United States, which was 4.6% year-over-year and 0.3% month-over-month, both of which were lower than estimates.
Equities
The S&P 500 gained 3.45% last week and ended the quarter up 7.46%. No news is good news right now, and it appears that the banking crisis might be over for now. The lack of news combined with positive inflation data caused markets to rally, as both are good signs for the future path of Federal Reserve policy.
Fixed Income
Interest rates have come up slightly since the SVB-induced crisis caused dramatic decreases in interest rates. It is not surprising to see the 2-year back above 4%, as the Fed Funds rate is currently in a target range of 4.75 - 5%. While inflation has continued to slow down, it is still higher than the Fed’s 2% target and thus it would not be surprising to see rates slightly increase as the banking crisis gets further and further in the rear-view mirror.
Commodities
Oil jumped to above $80 as OPEC announced surprise output cuts over the weekend that total about 1.16 million barrels per day, led by Saudi Arabia’s cut of 500,000 bpd. The surprise move has immediately boosted prices, which have been stubbornly low for some oil producers across the world. The US has not kept up its commitment to refill its strategic petroleum reserve, a move which has angered OPEC nations as that lack of demand has kept prices lower than many expected this year. This is believed to be the primary reason that OPEC announced the surprise cuts, as the cuts would decrease supply and boost prices since the US did not increase oil prices via the expected demand shock from the SPR boost.
Interesting Articles
- WSJ: For Chip Makers, a Choice Between the U.S. and China Looms
- WSJ: Small Banks Are Losing to Big Bank. Their Customers Are About to Feel It
- FT: Shale oil drillers left exposed after pulling back prices hedges
All data and figures in this article were collected from YCharts, Inc. on 03/31/2023 by Zach Hill of Blue Ridge Wealth Planners unless otherwise cited.
This material represents an assessment of the market and economic environment at a specific point in time and is not intended to be a forecast of future events, or a guarantee of future results. Forward-looking statements are subject to certain risks and uncertainties. Actual results, performance, or achievements may differ materially from those expressed or implied. Information is based on data gathered from what we believe are reliable sources. It is not guaranteed as to accuracy, does not purport to be complete and is not intended to be used as a primary basis for investment decisions. It should also not be construed as advice meeting the particular investment needs of any investor. Past performance does not guarantee future results.
Investments in emerging markets may be more volatile and less liquid than investing in developed markets and may involve exposure to economic structures that are generally less diverse and mature and to political systems which have less stability than those of more developed countries.
The performance figures shown are gross of investment advisory fees and other expenses. The deduction of these management fees and expenses would reduce the overall return. Because fees are deducted quarterly, the compounding effect would be to increase the impact of the fee deduction on gross account performance by a greater percentage than that of the annual fee charged. For example, if an account is charged a 1% management fee per year and has gross performance of 12% during that same period, the compounding effect of the quarterly fee assessments will result in an actual return of approximately 10.9%.
Investments in commodities may have greater volatility than investments in traditional securities, particularly if the instruments involve leverage. The value of commodity-linked derivative instruments may be affected by changes in overall market movements, commodity index volatility, changes in interest rates or factors affecting a particular industry or commodity, such as drought, floods, weather, livestock disease, embargoes, tariffs and international economic, political and regulatory developments. Use of leveraged commodity-linked derivatives creates an opportunity for increased return but, at the same time, creates the possibility for greater loss.
Indices are unmanaged and investors cannot invest directly in an index. Unless otherwise noted, performance of indices does not account for any fees, commissions or other expenses that would be incurred. Returns do not include reinvested dividends.
The Standard & Poor's 500 (S&P 500) is an unmanaged group of securities considered to be representative of the stock market in general. It is a market value weighted index with each stock's weight in the index proportionate to its market value.
The Financial Times Stock Exchange 100 Index, also called the FTSE 100 Index, FTSE 100, FTSE, or, informally, the "Footsie" is a share index of the 100 companies listed on the London Stock Exchange with the highest market capitalization. It is seen as a gauge of prosperity for businesses regulated by UK company law.
The FTSE Developed Europe Index is an index of European stocks, part of the FTSE Global Equity Index Series. It is a subset of the FTSE Europe Index. The FTSE Eurobloc Index is a subset of it.
The MSCI Emerging Markets Index is a float-adjusted market capitalization index that consists of indices in 21 emerging economies: Brazil, Chile, China, Colombia, Czech Republic, Egypt, Hungary, India, Indonesia, Korea, Malaysia, Mexico, Morocco, Peru, Philippines, Poland, Russia, South Africa, Taiwan, Thailand, and Turkey.
The Bloomberg Barclays US Aggregate Bond Index, or the Agg, is a broad base, market capitalization-weighted bond market index representing intermediate term investment grade bonds traded in the United States. Investors frequently use the index as a stand-in for measuring the performance of the US bond market.
The US Dollar Index (USDX, DXY) is an index (or measure) of the value of the United States dollar relative to a basket of foreign currencies, often referred to as a basket of US trade partners' currencies.
The Consumer Price Index (CPI) is a measure of inflation compiled by the US Bureau of Labor Studies.
West Texas Intermediate (WTI), also known as Texas light sweet, is a grade of crude oil used as a benchmark in oil pricing. This grade is described as light because of its relatively low density, and sweet because of its low sulfur content.
The Producer Price Index (PPI) is is a family of indexes that measures the average change over time in selling prices received by domestic producers of goods and services. PPIs measure price change from the perspective of the seller.
Market Update: March 20 - 24, 2023

Weekly Summary
Stock markets increased 1.5% last week despite the current banking turmoil and another increase from the Federal Reserve. The Fed took over as the primary focus in the markets after a 25bp rate hike on Wednesday, but banks again dominated most of the conversation and Deutsche Bank became the next bank targeted by investors. There was no material news on the bank, but the bank’s stock dropped by more than 10% on Friday on market fears that it might be the next bank to experience liquidity issues. Despite the Credit Suisse and Deutsche Bank news, stocks rallied and interest rates increased as there was relative calm in the regional banking sector as no new banks experienced significant liquidity pressure.
Economic Data
Year-over-year inflation in the United Kingdom was 10.4% during February, much hotter than the expectation of 9.9%. While US inflation seems to have peaked and has been on steady, albeit slow, deceleration, the 10.4% figure in the UK was an unexpected increase from January and shows that the country still has significant work to do to bring inflation back down.
Equities
The S&P 500 gained 1.5% and is now back up to nearly 4% year-to-date. Regional banks were still down roughly 2.5% last week, but the fact that there was no bank failure or significant negative news was a positive thing. The federal government was able to sell a significant part of Silicon Valley Bank over the weekend, which shows that the SVB failure could be specific to a handful of banks instead of a systemic crisis. Any absence of negative news for banks will be seen as a good and stabilizing force going forward.
Fixed Income
The Federal Reserve increased interest rates again last week, moving by just 25 basis points to a target range of 4.75 - 5%. While Powell did say that the Fed considered pausing rates immediately following the SVB crisis, they decided to go ahead with the move after inflation and employment data remained very strong in the days after the bank failed. The Fed believes that the banking sector is very strong and robust and does not believe that this crisis will become systematic. In fact, the Fed expects to increase rates one more time this year and then pause to determine the overall impact these hikes have had on inflation.
Commodities
Oil and natural gas have stayed in their relatively tight range due to the current banking crisis. Oil has experienced some downward pressure as the Biden administration has approved one of the largest Alaskan drilling projects in recent history. The Biden administration will allow ConocoPhillips to develop 68,000 acres of land in Alaska that are expected to produce 600 million barrels of oil over the next 30 years.
Interesting Articles
- WSJ: It Wasn’t Just Credit Suisse. Switzerland Itself Needed Rescuing.
- John Authers, Bloomberg: Move Along, There’s No Crisis to See Here
- CNBC: Biden Interior Approves Controversial Alaskan Drilling Project
All data and figures in this article were collected from YCharts, Inc. on 03/27/2023 by Zach Hill of Blue Ridge Wealth Planners unless otherwise cited.
This material represents an assessment of the market and economic environment at a specific point in time and is not intended to be a forecast of future events, or a guarantee of future results. Forward-looking statements are subject to certain risks and uncertainties. Actual results, performance, or achievements may differ materially from those expressed or implied. Information is based on data gathered from what we believe are reliable sources. It is not guaranteed as to accuracy, does not purport to be complete and is not intended to be used as a primary basis for investment decisions. It should also not be construed as advice meeting the particular investment needs of any investor. Past performance does not guarantee future results.
Investments in emerging markets may be more volatile and less liquid than investing in developed markets and may involve exposure to economic structures that are generally less diverse and mature and to political systems which have less stability than those of more developed countries.
The performance figures shown are gross of investment advisory fees and other expenses. The deduction of these management fees and expenses would reduce the overall return. Because fees are deducted quarterly, the compounding effect would be to increase the impact of the fee deduction on gross account performance by a greater percentage than that of the annual fee charged. For example, if an account is charged a 1% management fee per year and has gross performance of 12% during that same period, the compounding effect of the quarterly fee assessments will result in an actual return of approximately 10.9%.
Investments in commodities may have greater volatility than investments in traditional securities, particularly if the instruments involve leverage. The value of commodity-linked derivative instruments may be affected by changes in overall market movements, commodity index volatility, changes in interest rates or factors affecting a particular industry or commodity, such as drought, floods, weather, livestock disease, embargoes, tariffs and international economic, political and regulatory developments. Use of leveraged commodity-linked derivatives creates an opportunity for increased return but, at the same time, creates the possibility for greater loss.
Indices are unmanaged and investors cannot invest directly in an index. Unless otherwise noted, performance of indices does not account for any fees, commissions or other expenses that would be incurred. Returns do not include reinvested dividends.
The Standard & Poor's 500 (S&P 500) is an unmanaged group of securities considered to be representative of the stock market in general. It is a market value weighted index with each stock's weight in the index proportionate to its market value.
The Financial Times Stock Exchange 100 Index, also called the FTSE 100 Index, FTSE 100, FTSE, or, informally, the "Footsie" is a share index of the 100 companies listed on the London Stock Exchange with the highest market capitalization. It is seen as a gauge of prosperity for businesses regulated by UK company law.
The FTSE Developed Europe Index is an index of European stocks, part of the FTSE Global Equity Index Series. It is a subset of the FTSE Europe Index. The FTSE Eurobloc Index is a subset of it.
The MSCI Emerging Markets Index is a float-adjusted market capitalization index that consists of indices in 21 emerging economies: Brazil, Chile, China, Colombia, Czech Republic, Egypt, Hungary, India, Indonesia, Korea, Malaysia, Mexico, Morocco, Peru, Philippines, Poland, Russia, South Africa, Taiwan, Thailand, and Turkey.
The Bloomberg Barclays US Aggregate Bond Index, or the Agg, is a broad base, market capitalization-weighted bond market index representing intermediate term investment grade bonds traded in the United States. Investors frequently use the index as a stand-in for measuring the performance of the US bond market.
The US Dollar Index (USDX, DXY) is an index (or measure) of the value of the United States dollar relative to a basket of foreign currencies, often referred to as a basket of US trade partners' currencies.
The Consumer Price Index (CPI) is a measure of inflation compiled by the US Bureau of Labor Studies.
West Texas Intermediate (WTI), also known as Texas light sweet, is a grade of crude oil used as a benchmark in oil pricing. This grade is described as light because of its relatively low density, and sweet because of its low sulfur content.
The Producer Price Index (PPI) is is a family of indexes that measures the average change over time in selling prices received by domestic producers of goods and services. PPIs measure price change from the perspective of the seller.
Market Update: March 13 - 17, 2023

Weekly Summary
Global stock, bond, and commodity markets experienced extreme turmoil as the current banking crisis spread to European and international banks as well as US regional banks.
Early in the week the focus was on the current state of Silicon Valley Bank, which the federal government had closed on Friday, March 10. Over last weekend, the FDIC and US Treasury stepped in to insure deposits beyond the FDIC $250,000 limit and offered a few different liquidity programs to help banks weather a potential run on deposits. The moves were largely seen as successful, and markets responded very positively early in the week until it appeared that other banks might be in serious trouble.
The next bank to spark fears was the regional bank First Republic, which began to see large deposit outflows after the SVB collapse. A contingency of larger banks, such as JP Morgan, responded by depositing a total of $30 billion at the bank to help the bank stay above water until the run ended. This was essentially a private sector led bailout of a bank, and the stock market responded to this news with mixed results. First Republic’s shares were down a total of 14% last week, but experienced extreme volatility with both gains and losses on individual days of more than 20%. It was down 32.8% on Friday after there were fears that the bailout would not be enough.
The next bank to fall in the puzzle was Swiss bank Credit Suisse, one of the largest banks in the world. Last year, Saudi National Bank purchased roughly 10% of the bank. As the banking crisis accelerated last week, there were market whispers that Credit Suisse was experiencing very large outflows and was at risk of needing assistance. Saudi National Bank responded by saying they would not be providing any additional assistance to the bank, which then prompted the bank to actually experience large outflows. Over the weekend, the bank agreed to sell itself to Switzerland-based investment bank UBS for $3.2 billion in a very controversial move. The Swiss National Bank had offered assistance to Credit Suisse to help the bank stay afloat, but it appeared that was not enough so the bank agreed to a purchase by UBS.
While this was not a bailout per se, it could be interpreted as a bank failure. That would make it one of the largest bank failures in history, and it is a significant domino to fall in the current banking crisis. One interesting thing to note about the entire crisis is how this money is moving about. Bank runs are self-fulfilling prophecies; once they begin to happen, they speed up a bank’s demise and therefore all but guarantee its failure. Now that we have seen bank runs on many large banks, the next logical question is: where is this money going?
With billions of dollars on the line, it is not something where banks can simply hide it under a mattress. They have to be depositing it somewhere. So the next piece of the puzzle that remains to be seen is where this money is going. It is not everyday people who are causing these bank runs. It is large companies with millions of dollars in the bank. We can only speculate where this money is being deposited at the current moment, but one common belief is that it is simply going into some of the biggest banks in the US that have received implicit government guarantees, such as JP Morgan.
Economic Data
The February inflation report was released last week and was in-line with expectations as year-over-year inflation was 6%, while monthly inflation was 0.4%. Investors largely shrugged off this report as the banking news was the main focus on the week.
Equities
The S&P 500 gained 1.45% last week as it experienced extreme volatility. Regional banks ended the week with a loss of just 2% but had similar bouts of volatility even though the weekly loss was relatively muted. On Friday alone, the regional banking sector lost 6%.
Fixed Income
The 2-year saw its most extreme moves since 2001 last week, as it dropped from 5% to 3.75% in a matter of days as markets expect that the Federal Reserve’s path of interest rates will now be significantly impacted by the current banking crisis. The 10-year is now down nearly a full percent from its recent highs and sits at just 3.36%. The Federal Reserve will make its next interest rate decision on Wednesday, and the current expectation for what they will do is changing nearly every hour. In my opinion, it would be a grave mistake for the Fed to increase interest rates during a banking crisis that has been started partially because they increased interest rates so quickly. However, Jerome Powell believes that he can be the next Paul Volcker in this inflationary environment and appears to be locked in to one goal and one goal only: beating inflation. This is shaping up to be one of the most contentious Fed meetings in recent history.
Commodities
Oil and natural gas continued their recent falls on the back of the current banking crisis, and oil is now down nearly 50% from where it was a year ago.
Interesting Articles
- WSJ: First Republic, SVB, Credit Suisse Show How Higher Interest Rates Caught Up With Banks
- Reuters: S&P cuts First Republic deeper into junk, says $30 billion infusion may not solve problems
- Bloomberg: Fed's New Backstop Shields Banks From $300 Billion of Losses
- WSJ: ECB Raises Rates by Half Point Despite Mounting Banking Stress
All data and figures in this article were collected from YCharts, Inc. on 03/20/2023 by Zach Hill of Blue Ridge Wealth Planners unless otherwise cited.
This material represents an assessment of the market and economic environment at a specific point in time and is not intended to be a forecast of future events, or a guarantee of future results. Forward-looking statements are subject to certain risks and uncertainties. Actual results, performance, or achievements may differ materially from those expressed or implied. Information is based on data gathered from what we believe are reliable sources. It is not guaranteed as to accuracy, does not purport to be complete and is not intended to be used as a primary basis for investment decisions. It should also not be construed as advice meeting the particular investment needs of any investor. Past performance does not guarantee future results.
Investments in emerging markets may be more volatile and less liquid than investing in developed markets and may involve exposure to economic structures that are generally less diverse and mature and to political systems which have less stability than those of more developed countries.
The performance figures shown are gross of investment advisory fees and other expenses. The deduction of these management fees and expenses would reduce the overall return. Because fees are deducted quarterly, the compounding effect would be to increase the impact of the fee deduction on gross account performance by a greater percentage than that of the annual fee charged. For example, if an account is charged a 1% management fee per year and has gross performance of 12% during that same period, the compounding effect of the quarterly fee assessments will result in an actual return of approximately 10.9%.
Investments in commodities may have greater volatility than investments in traditional securities, particularly if the instruments involve leverage. The value of commodity-linked derivative instruments may be affected by changes in overall market movements, commodity index volatility, changes in interest rates or factors affecting a particular industry or commodity, such as drought, floods, weather, livestock disease, embargoes, tariffs and international economic, political and regulatory developments. Use of leveraged commodity-linked derivatives creates an opportunity for increased return but, at the same time, creates the possibility for greater loss.
Indices are unmanaged and investors cannot invest directly in an index. Unless otherwise noted, performance of indices does not account for any fees, commissions or other expenses that would be incurred. Returns do not include reinvested dividends.
The Standard & Poor's 500 (S&P 500) is an unmanaged group of securities considered to be representative of the stock market in general. It is a market value weighted index with each stock's weight in the index proportionate to its market value.
The Financial Times Stock Exchange 100 Index, also called the FTSE 100 Index, FTSE 100, FTSE, or, informally, the "Footsie" is a share index of the 100 companies listed on the London Stock Exchange with the highest market capitalization. It is seen as a gauge of prosperity for businesses regulated by UK company law.
The FTSE Developed Europe Index is an index of European stocks, part of the FTSE Global Equity Index Series. It is a subset of the FTSE Europe Index. The FTSE Eurobloc Index is a subset of it.
The MSCI Emerging Markets Index is a float-adjusted market capitalization index that consists of indices in 21 emerging economies: Brazil, Chile, China, Colombia, Czech Republic, Egypt, Hungary, India, Indonesia, Korea, Malaysia, Mexico, Morocco, Peru, Philippines, Poland, Russia, South Africa, Taiwan, Thailand, and Turkey.
The Bloomberg Barclays US Aggregate Bond Index, or the Agg, is a broad base, market capitalization-weighted bond market index representing intermediate term investment grade bonds traded in the United States. Investors frequently use the index as a stand-in for measuring the performance of the US bond market.
The US Dollar Index (USDX, DXY) is an index (or measure) of the value of the United States dollar relative to a basket of foreign currencies, often referred to as a basket of US trade partners' currencies.
The Consumer Price Index (CPI) is a measure of inflation compiled by the US Bureau of Labor Studies.
West Texas Intermediate (WTI), also known as Texas light sweet, is a grade of crude oil used as a benchmark in oil pricing. This grade is described as light because of its relatively low density, and sweet because of its low sulfur content.
The Producer Price Index (PPI) is is a family of indexes that measures the average change over time in selling prices received by domestic producers of goods and services. PPIs measure price change from the perspective of the seller.
Market Update: February 27 - March 3, 2023

Weekly Summary
Stocks saw some relief from recent losses, as the S&P 500 posted a gain of nearly 2% last week alongside mixed economic data. The US dollar weakened as Eurozone inflation remains higher than US inflation, and markets now expect the ECB to continue its tightening cycle through the rest of 2023. This dollar weakness has led to strength in emerging market equities, which increased over 3% last week.
Economic Data
Pending home sales jumped 8.1% last month compared to economist expectations of 1% growth off the back of lower mortgage rates, and housing prices continued their monthly declines by declining 0.9% during December. Housing prices have now declined for six straight months on a month-over-month basis, which is one of the key reasons markets are hopeful that the worst of inflation is behind us.
Equities
After dropping nearly 5% during the month of February, the S&P 500 increased 1.97% last week to begin the month of March as economic data was largely mixed during the week. With interest rates as high as they are, there continues to be a discussion within the market of the current tradeoff between stocks and bonds. In fact, the earnings yield on the S&P 500 is now just over 5%, which is roughly the same as the six-month Treasury bill. One interpretation of this ratio is that markets are saying that stocks are relatively overvalued for their risk, while short-term bonds are relatively attractive for their risk.
Fixed Income
Interest rates initially rose to start the week, with the 10-year briefly going above 4% before moderating towards the end of the week. The six-month Treasury is now yielding 5.13%, which is the highest across the yield curve.
Commodities
Oil remains firmly in the $70-80 range at $78.61, but is now 34% lower than it was a year ago, which again should be good news for March’s inflation figure. Natural gas has also settled into a tight range, as warmer weather has significantly helped supply catch up to demand across the globe. The Freeport LNG export plant, which was closed in June 2022 after an explosion, has quietly reopened in the last few weeks allowing LNG exports to Europe to resume. This supply is crucial in helping Europe ween off of Russian natural gas, and the US has more than enough domestic production to meet demand so there is plenty of natural gas to export. Natural gas prices are down 73% from their peak in summer 2022.
Interesting Articles
- WSJ: Markets History 101: It’s Time to Buy Bonds
- CNBC: A rush of homes go under contract in January, but it’s unlikely to last
- Bloomberg: The Year That Redrew the Energy Map
All data and figures in this article were collected from YCharts, Inc. on 03/06/2023 by Zach Hill of Blue Ridge Wealth Planners unless otherwise cited.
This material represents an assessment of the market and economic environment at a specific point in time and is not intended to be a forecast of future events, or a guarantee of future results. Forward-looking statements are subject to certain risks and uncertainties. Actual results, performance, or achievements may differ materially from those expressed or implied. Information is based on data gathered from what we believe are reliable sources. It is not guaranteed as to accuracy, does not purport to be complete and is not intended to be used as a primary basis for investment decisions. It should also not be construed as advice meeting the particular investment needs of any investor. Past performance does not guarantee future results.
Investments in emerging markets may be more volatile and less liquid than investing in developed markets and may involve exposure to economic structures that are generally less diverse and mature and to political systems which have less stability than those of more developed countries.
The performance figures shown are gross of investment advisory fees and other expenses. The deduction of these management fees and expenses would reduce the overall return. Because fees are deducted quarterly, the compounding effect would be to increase the impact of the fee deduction on gross account performance by a greater percentage than that of the annual fee charged. For example, if an account is charged a 1% management fee per year and has gross performance of 12% during that same period, the compounding effect of the quarterly fee assessments will result in an actual return of approximately 10.9%.
Investments in commodities may have greater volatility than investments in traditional securities, particularly if the instruments involve leverage. The value of commodity-linked derivative instruments may be affected by changes in overall market movements, commodity index volatility, changes in interest rates or factors affecting a particular industry or commodity, such as drought, floods, weather, livestock disease, embargoes, tariffs and international economic, political and regulatory developments. Use of leveraged commodity-linked derivatives creates an opportunity for increased return but, at the same time, creates the possibility for greater loss.
Indices are unmanaged and investors cannot invest directly in an index. Unless otherwise noted, performance of indices does not account for any fees, commissions or other expenses that would be incurred. Returns do not include reinvested dividends.
The Standard & Poor's 500 (S&P 500) is an unmanaged group of securities considered to be representative of the stock market in general. It is a market value weighted index with each stock's weight in the index proportionate to its market value.
The Financial Times Stock Exchange 100 Index, also called the FTSE 100 Index, FTSE 100, FTSE, or, informally, the "Footsie" is a share index of the 100 companies listed on the London Stock Exchange with the highest market capitalization. It is seen as a gauge of prosperity for businesses regulated by UK company law.
The FTSE Developed Europe Index is an index of European stocks, part of the FTSE Global Equity Index Series. It is a subset of the FTSE Europe Index. The FTSE Eurobloc Index is a subset of it.
The MSCI Emerging Markets Index is a float-adjusted market capitalization index that consists of indices in 21 emerging economies: Brazil, Chile, China, Colombia, Czech Republic, Egypt, Hungary, India, Indonesia, Korea, Malaysia, Mexico, Morocco, Peru, Philippines, Poland, Russia, South Africa, Taiwan, Thailand, and Turkey.
The Bloomberg Barclays US Aggregate Bond Index, or the Agg, is a broad base, market capitalization-weighted bond market index representing intermediate term investment grade bonds traded in the United States. Investors frequently use the index as a stand-in for measuring the performance of the US bond market.
The US Dollar Index (USDX, DXY) is an index (or measure) of the value of the United States dollar relative to a basket of foreign currencies, often referred to as a basket of US trade partners' currencies.
The Consumer Price Index (CPI) is a measure of inflation compiled by the US Bureau of Labor Studies.
West Texas Intermediate (WTI), also known as Texas light sweet, is a grade of crude oil used as a benchmark in oil pricing. This grade is described as light because of its relatively low density, and sweet because of its low sulfur content.
The Producer Price Index (PPI) is is a family of indexes that measures the average change over time in selling prices received by domestic producers of goods and services. PPIs measure price change from the perspective of the seller.
Market Update: February 20 - 24, 2023

Weekly Summary
Stock and bond continued their recent declines as inflation data continues to come in hotter than expected. The S&P 500 has now decreased 5% during the month of February as markets continue to be worried that inflation is not yet over. It has been an exhausting year, as this is seemingly the only thing that the stock and bond markets will care about going forward.
Economic Data
The Personal Consumption Expenditures Index, the Federal Reserve’s preferred inflation measure, was released last week and came in much hotter than expected. The core PCE was up 0.6% month-over-month, which was higher than the expectation of 0.4%. Headline PCE was also higher than expected at 0.6%, but was also much higher from December’s 0.2% growth.
Equities
The S&P 500 has now dropped nearly 5% in the month of February and lost 2.9% last week. Earnings season for the fourth quarter of 2022 has been mixed at best. While 68% of S&P 500 companies have beaten earnings expectations, earnings actually declined by 3.3% in the quarter. One interesting insight from these earnings calls has been their mention of the term “inflation.” According to FactSet, 325 companies mentioned the term “inflation” somewhere on their conference calls, which is the lowest number of mentions since Q3 2021. One example of this was on the Kraft Heinz earnings call, where the company did mention inflation in a positive light. The company stated that they raised prices 15.2% overall in 2022, but that they do not expect to increase prices at all in 2023 as the majority of their inflation headwinds have passed.
Fixed Income
Interest rates rose last week and the 2-year is now at its highest level since 2007 as markets begin to price in a small chance that the Federal Reserve will hike by 50 basis points at its next meeting. US retail sales for January were another positive for the economy, as sales increased by 3% in January for their largest monthly increase since March 2021. This provided yet another boost to interest rates as it appears the economy is showing no signs of slowing down.
Interesting Articles
- FactSet: Earnings Insight Q4 2022
- FT: US gas export plant hit by blast reopens with uncertain future
- WSJ: Stocks Rally Despite Squeeze on Profitability
All data and figures in this article were collected from YCharts, Inc. on 02/27/2023 by Zach Hill of Blue Ridge Wealth Planners unless otherwise cited.
This material represents an assessment of the market and economic environment at a specific point in time and is not intended to be a forecast of future events, or a guarantee of future results. Forward-looking statements are subject to certain risks and uncertainties. Actual results, performance, or achievements may differ materially from those expressed or implied. Information is based on data gathered from what we believe are reliable sources. It is not guaranteed as to accuracy, does not purport to be complete and is not intended to be used as a primary basis for investment decisions. It should also not be construed as advice meeting the particular investment needs of any investor. Past performance does not guarantee future results.
Investments in emerging markets may be more volatile and less liquid than investing in developed markets and may involve exposure to economic structures that are generally less diverse and mature and to political systems which have less stability than those of more developed countries.
The performance figures shown are gross of investment advisory fees and other expenses. The deduction of these management fees and expenses would reduce the overall return. Because fees are deducted quarterly, the compounding effect would be to increase the impact of the fee deduction on gross account performance by a greater percentage than that of the annual fee charged. For example, if an account is charged a 1% management fee per year and has gross performance of 12% during that same period, the compounding effect of the quarterly fee assessments will result in an actual return of approximately 10.9%.
Investments in commodities may have greater volatility than investments in traditional securities, particularly if the instruments involve leverage. The value of commodity-linked derivative instruments may be affected by changes in overall market movements, commodity index volatility, changes in interest rates or factors affecting a particular industry or commodity, such as drought, floods, weather, livestock disease, embargoes, tariffs and international economic, political and regulatory developments. Use of leveraged commodity-linked derivatives creates an opportunity for increased return but, at the same time, creates the possibility for greater loss.
Indices are unmanaged and investors cannot invest directly in an index. Unless otherwise noted, performance of indices does not account for any fees, commissions or other expenses that would be incurred. Returns do not include reinvested dividends.
The Standard & Poor's 500 (S&P 500) is an unmanaged group of securities considered to be representative of the stock market in general. It is a market value weighted index with each stock's weight in the index proportionate to its market value.
The Financial Times Stock Exchange 100 Index, also called the FTSE 100 Index, FTSE 100, FTSE, or, informally, the "Footsie" is a share index of the 100 companies listed on the London Stock Exchange with the highest market capitalization. It is seen as a gauge of prosperity for businesses regulated by UK company law.
The FTSE Developed Europe Index is an index of European stocks, part of the FTSE Global Equity Index Series. It is a subset of the FTSE Europe Index. The FTSE Eurobloc Index is a subset of it.
The MSCI Emerging Markets Index is a float-adjusted market capitalization index that consists of indices in 21 emerging economies: Brazil, Chile, China, Colombia, Czech Republic, Egypt, Hungary, India, Indonesia, Korea, Malaysia, Mexico, Morocco, Peru, Philippines, Poland, Russia, South Africa, Taiwan, Thailand, and Turkey.
The Bloomberg Barclays US Aggregate Bond Index, or the Agg, is a broad base, market capitalization-weighted bond market index representing intermediate term investment grade bonds traded in the United States. Investors frequently use the index as a stand-in for measuring the performance of the US bond market.
The US Dollar Index (USDX, DXY) is an index (or measure) of the value of the United States dollar relative to a basket of foreign currencies, often referred to as a basket of US trade partners' currencies.
The Consumer Price Index (CPI) is a measure of inflation compiled by the US Bureau of Labor Studies.
West Texas Intermediate (WTI), also known as Texas light sweet, is a grade of crude oil used as a benchmark in oil pricing. This grade is described as light because of its relatively low density, and sweet because of its low sulfur content.
The Producer Price Index (PPI) is is a family of indexes that measures the average change over time in selling prices received by domestic producers of goods and services. PPIs measure price change from the perspective of the seller.
Market Update: February 13 - 17, 2023

Weekly Summary
For the past 18 months, the market's focus has been on the release of CPI data, which has driven market movements week after week. This trend is likely to continue through 2023 as well. In January, the inflation rate was in line with expectations at 6.4%, but core CPI was higher than expected at 5.6% YoY. This was seen as bad news across the board, with stocks decreasing and interest rates shooting up to 2023 highs. The fear is that inflation might not be coming down as quickly as hoped, especially since this was preceded by a string of lower-than-expected inflation rates.
Economic Data
The CPI release for January was the most watched figure for the week. The data was relatively in-line with economists’ expectations, with some interesting data under the hood. Used car prices, one of the first indicators of high inflation in 2021, were down 11.6% from 2022. On the other side, the biggest factor in the stubbornly high inflation number continues to be shelter, which increased 7.9% from 2023 and was up 0.7% from last month. As we have repeatedly stated, this figure is on a known 12-month lag, so this should remain higher than the other inputs for a while as we wait for that input-lag to come out of the data.
Equities
The S&P 500 decreased 0.19% last week, but remain at YTD gains of 6.49% for 2023. European equities continued their march higher and have now outperformed US equities by nearly 4% this year. The European Commission stated last week that they now believe that Europe can avoid a recession in 2023 thanks to falling energy prices. There was significant worry in the European economy in 2022 that the Russia and Ukraine war would cause energy shortages across the bloc, but after a warm winter those fears never materialized and now natural gas prices are at a two-year low due to the decrease in expected demand.
Fixed Income
Interest rates continued their recent increases and are now at 2023 highs across the board following the inflation data. The Federal Reserve did not do much to calm bond markets down last week, as many Fed governors had harsh comments following the inflation data. Cleveland Federal Reserve President Loretta Mester said there was a “compelling economic case” for another 50 basis point rate increase at the next meeting. The Fed hiked just 25 basis points at their February meeting, so a 50bp increase would be an unwelcome return to a very hawkish Fed. Markets are currently only placing a 21% probability on a 50bp increase, but it does appear that the Fed is considering the move following the jobs and inflation data from January.
Commodities
Oil and natural gas continue to remain at relatively low levels, as the supply disruptions and demand spikes from 2022 have significantly waned. Natural gas is currently at a 2-year low at $2.26.
Interesting Articles
- CNBC: CPI Release - January 2023
- FT: EU set to avoid recession following gas price fall, says Brussels
- WSJ: Inflation Is Falling, and Where It Lands Depends on Three Things
All data and figures in this article were collected from YCharts, Inc. on 02/20/2023 by Zach Hill of Blue Ridge Wealth Planners unless otherwise cited.
This material represents an assessment of the market and economic environment at a specific point in time and is not intended to be a forecast of future events, or a guarantee of future results. Forward-looking statements are subject to certain risks and uncertainties. Actual results, performance, or achievements may differ materially from those expressed or implied. Information is based on data gathered from what we believe are reliable sources. It is not guaranteed as to accuracy, does not purport to be complete and is not intended to be used as a primary basis for investment decisions. It should also not be construed as advice meeting the particular investment needs of any investor. Past performance does not guarantee future results.
Investments in emerging markets may be more volatile and less liquid than investing in developed markets and may involve exposure to economic structures that are generally less diverse and mature and to political systems which have less stability than those of more developed countries.
The performance figures shown are gross of investment advisory fees and other expenses. The deduction of these management fees and expenses would reduce the overall return. Because fees are deducted quarterly, the compounding effect would be to increase the impact of the fee deduction on gross account performance by a greater percentage than that of the annual fee charged. For example, if an account is charged a 1% management fee per year and has gross performance of 12% during that same period, the compounding effect of the quarterly fee assessments will result in an actual return of approximately 10.9%.
Investments in commodities may have greater volatility than investments in traditional securities, particularly if the instruments involve leverage. The value of commodity-linked derivative instruments may be affected by changes in overall market movements, commodity index volatility, changes in interest rates or factors affecting a particular industry or commodity, such as drought, floods, weather, livestock disease, embargoes, tariffs and international economic, political and regulatory developments. Use of leveraged commodity-linked derivatives creates an opportunity for increased return but, at the same time, creates the possibility for greater loss.
Indices are unmanaged and investors cannot invest directly in an index. Unless otherwise noted, performance of indices does not account for any fees, commissions or other expenses that would be incurred. Returns do not include reinvested dividends.
The Standard & Poor's 500 (S&P 500) is an unmanaged group of securities considered to be representative of the stock market in general. It is a market value weighted index with each stock's weight in the index proportionate to its market value.
The Financial Times Stock Exchange 100 Index, also called the FTSE 100 Index, FTSE 100, FTSE, or, informally, the "Footsie" is a share index of the 100 companies listed on the London Stock Exchange with the highest market capitalization. It is seen as a gauge of prosperity for businesses regulated by UK company law.
The FTSE Developed Europe Index is an index of European stocks, part of the FTSE Global Equity Index Series. It is a subset of the FTSE Europe Index. The FTSE Eurobloc Index is a subset of it.
The MSCI Emerging Markets Index is a float-adjusted market capitalization index that consists of indices in 21 emerging economies: Brazil, Chile, China, Colombia, Czech Republic, Egypt, Hungary, India, Indonesia, Korea, Malaysia, Mexico, Morocco, Peru, Philippines, Poland, Russia, South Africa, Taiwan, Thailand, and Turkey.
The Bloomberg Barclays US Aggregate Bond Index, or the Agg, is a broad base, market capitalization-weighted bond market index representing intermediate term investment grade bonds traded in the United States. Investors frequently use the index as a stand-in for measuring the performance of the US bond market.
The US Dollar Index (USDX, DXY) is an index (or measure) of the value of the United States dollar relative to a basket of foreign currencies, often referred to as a basket of US trade partners' currencies.
The Consumer Price Index (CPI) is a measure of inflation compiled by the US Bureau of Labor Studies.
West Texas Intermediate (WTI), also known as Texas light sweet, is a grade of crude oil used as a benchmark in oil pricing. This grade is described as light because of its relatively low density, and sweet because of its low sulfur content.
The Producer Price Index (PPI) is is a family of indexes that measures the average change over time in selling prices received by domestic producers of goods and services. PPIs measure price change from the perspective of the seller.
Market Update: February 6 - 10, 2023

Weekly Summary
Stock markets declined and interest rates rose last week after the January jobs report showed a shocking increase in job gains for the month. The moves last week looked eerily similar to those seen during most of 2022: interest rates up and stocks down as the fear of continued Federal Reserve rate increases became the sole focus. The jobs report was so strong that it overshadowed the recent data showing inflation could have moderated, and markets will be zeroed in on the inflation report this week to look for confirmation of that thesis.
Economic Data
The January jobs report was one of the biggest surprises in recent releases. The report showed that the economy added 517,000 jobs during the month while economists estimated the economy would add just 187,000. The increase in payrolls caused the unemployment rate to fall to 3.4%, its lowest rate since May 1969. Payroll gains have moderated over the past five months, hovering between about 250k-300k payrolls added per month. This exceptionally strong job growth was very unexpected and caused very large moves in interest rates.
Equities
The S&P 500 decreased 1.05% last week as stock markets focused on the hot jobs report from January and a disappointing earnings season for Q4 2022. About 70% of the companies in the S&P 500 have reported earnings so far, and about 70% of those companies have beaten earnings per share estimates. While on the surface this might appear positive, it is actually about average as far as upside earnings surprises go. What is more interesting is that companies that have surprised to the upside on EPS have only done so by about 1.1%, which is below the 5-year average of 8.6%. This means that while companies might be positive better than expected results, the magnitude is not nearly as high as usual.
Fixed Income
Interest rates have risen significantly over the past two weeks, resuming the trend higher after better than expected economic data. The Federal Reserve has already raised interest rates once this year, and now markets are pricing in at least a 25bp hike in February. The probability of that 25bp hike becoming 50bp will increase dramatically should inflation come in hotter than expected during this week’s report.
Commodities
Oil and natural gas continue to remain at relatively low levels, as the supply disruptions and demand spikes from 2022 have significantly waned. The most noteworthy story in commodity markets during the first quarter will be the dramatic price declines from Q1 2022. As you can see in the chart above, the price of oil one year ago was $95.46 per barrel. The current price of $79.69 is a 16.5% decline and would be a roughly 34% decrease from the highs of Q1 2022. This is a significant input into inflation and is a major part of the market expectation that inflation will continue to moderate this year.
Interesting Articles
- CNBC: January Jobs Report
- FactSet: Earnings Insight Q4 2022
- Ben Carlson: Where Have All the $200,000 Houses Gone?
All data and figures in this article were collected from YCharts, Inc. on 02/13/2023 by Zach Hill of Blue Ridge Wealth Planners unless otherwise cited.
This material represents an assessment of the market and economic environment at a specific point in time and is not intended to be a forecast of future events, or a guarantee of future results. Forward-looking statements are subject to certain risks and uncertainties. Actual results, performance, or achievements may differ materially from those expressed or implied. Information is based on data gathered from what we believe are reliable sources. It is not guaranteed as to accuracy, does not purport to be complete and is not intended to be used as a primary basis for investment decisions. It should also not be construed as advice meeting the particular investment needs of any investor. Past performance does not guarantee future results.
Investments in emerging markets may be more volatile and less liquid than investing in developed markets and may involve exposure to economic structures that are generally less diverse and mature and to political systems which have less stability than those of more developed countries.
The performance figures shown are gross of investment advisory fees and other expenses. The deduction of these management fees and expenses would reduce the overall return. Because fees are deducted quarterly, the compounding effect would be to increase the impact of the fee deduction on gross account performance by a greater percentage than that of the annual fee charged. For example, if an account is charged a 1% management fee per year and has gross performance of 12% during that same period, the compounding effect of the quarterly fee assessments will result in an actual return of approximately 10.9%.
Investments in commodities may have greater volatility than investments in traditional securities, particularly if the instruments involve leverage. The value of commodity-linked derivative instruments may be affected by changes in overall market movements, commodity index volatility, changes in interest rates or factors affecting a particular industry or commodity, such as drought, floods, weather, livestock disease, embargoes, tariffs and international economic, political and regulatory developments. Use of leveraged commodity-linked derivatives creates an opportunity for increased return but, at the same time, creates the possibility for greater loss.
Indices are unmanaged and investors cannot invest directly in an index. Unless otherwise noted, performance of indices does not account for any fees, commissions or other expenses that would be incurred. Returns do not include reinvested dividends.
The Standard & Poor's 500 (S&P 500) is an unmanaged group of securities considered to be representative of the stock market in general. It is a market value weighted index with each stock's weight in the index proportionate to its market value.
The Financial Times Stock Exchange 100 Index, also called the FTSE 100 Index, FTSE 100, FTSE, or, informally, the "Footsie" is a share index of the 100 companies listed on the London Stock Exchange with the highest market capitalization. It is seen as a gauge of prosperity for businesses regulated by UK company law.
The FTSE Developed Europe Index is an index of European stocks, part of the FTSE Global Equity Index Series. It is a subset of the FTSE Europe Index. The FTSE Eurobloc Index is a subset of it.
The MSCI Emerging Markets Index is a float-adjusted market capitalization index that consists of indices in 21 emerging economies: Brazil, Chile, China, Colombia, Czech Republic, Egypt, Hungary, India, Indonesia, Korea, Malaysia, Mexico, Morocco, Peru, Philippines, Poland, Russia, South Africa, Taiwan, Thailand, and Turkey.
The Bloomberg Barclays US Aggregate Bond Index, or the Agg, is a broad base, market capitalization-weighted bond market index representing intermediate term investment grade bonds traded in the United States. Investors frequently use the index as a stand-in for measuring the performance of the US bond market.
The US Dollar Index (USDX, DXY) is an index (or measure) of the value of the United States dollar relative to a basket of foreign currencies, often referred to as a basket of US trade partners' currencies.
The Consumer Price Index (CPI) is a measure of inflation compiled by the US Bureau of Labor Studies.
West Texas Intermediate (WTI), also known as Texas light sweet, is a grade of crude oil used as a benchmark in oil pricing. This grade is described as light because of its relatively low density, and sweet because of its low sulfur content.
The Producer Price Index (PPI) is is a family of indexes that measures the average change over time in selling prices received by domestic producers of goods and services. PPIs measure price change from the perspective of the seller.
Market Update: January 23 - 27, 2023

Weekly Summary
Stock and bond markets resumed their 2023 rally last week, with the S&P 500 ending the week up nearly 2.5% due to strong economic growth and strong earnings. Q4 GDP was released and came in higher than expected, showing growth of 2.9%. Interest rates moderated from their highs in mid-2022 as markets continue to focus on the Federal Reserve. The Federal Reserve meets on February 1 and is expected to increase interest rates just 25 basis points, their slowest increase since the tightening cycle began last year.
Economic Data
The biggest story of the week was the better-than-expected GDP figure from Q4 2022, but there was another big release that flew under the radar: December Durable Goods. Durable goods orders measures the new orders placed with manufacturers for goods that are meant to last at least three years. New orders for December were expected to growth 2.5% month over month, but actually grew 5.6%. That is overwhelmingly good news and is yet another sign that the economy is growing at a healthy pace despite the inflation fears.
Equities
The S&P 500 increased nearly 2.5% last week as Q4 earnings season remains in full swing. The current earnings growth rate for the quarter shows an earnings contraction of 5%, but most companies are reporting better than expected results. So things are bad, but not as bad as they could be. The decline is primarily due to margin compression caused by rising costs.. Companies in the index increased prices during 2021 and 2022 and passed on a lot of that margin compression to consumers via high prices. Now those costs have outpaced companies’ belief that they can increase their prices, so their margins are compressed. The market does not appear to be overly concerned about this, as stocks are now up 6% in 2023.
Fixed Income
Interest rates were relatively calm last week as markets prepare for the Federal Reserve meeting this week. All eyes are on the future path of the Fed, and there are still significant fears that the Fed might have already tightened too much. This fear of over-tightening has pushed the 10 and 30-year rates down to below 4%. The long-end of the Treasury curve typically comes down during the tightening cycle when interest rate markets begin to believe a recession is on the horizon. The other possible scenario is a soft landing where inflation comes down significantly without a recession. In either the recession or soft landing scenarios, the long-end of the curve will be lower as either inflation or economic growth will be significantly lower later this year. If neither of these scenarios happen, it is possible that interest rates could resume their trend higher.
Commodities
Natural gas hit a two-year low of 2.67 last week as warmer weather across the world decreases overall demand for gas during what is normally a high use period. Natural gas prices are very weather dependent, and this decline is almost entirely due to warmer weather. Because of the Russia-Ukraine supply disruptions, Europe spent much of the fall filling their storage capacity as quickly as possible as the European Union was extremely fearful of a natural gas shortage if it was a harsh winter. Since weather across much of the world has been much warmer than average, that shortage never materialized, and Europe has had ample gas supply for the season. The increase in storage caused a decrease in demand, and at the same time demand was lower in the US due to the warmer weather. These patterns have pushed natural gas to levels not seen since Spring 2021.
Interesting Articles
- WSJ: Companies Cut Temp Workers in Warning Sign for Labor Market
- Nick Maggiulli: Are Declining Interest Rates Responsible for Stock Growth?
- Bloomberg: Debt Limit Fight Risks Early End to Fed QT
All data and figures in this article were collected from YCharts, Inc. on 01/27/2023 by Zach Hill of Blue Ridge Wealth Planners unless otherwise cited.
This material represents an assessment of the market and economic environment at a specific point in time and is not intended to be a forecast of future events, or a guarantee of future results. Forward-looking statements are subject to certain risks and uncertainties. Actual results, performance, or achievements may differ materially from those expressed or implied. Information is based on data gathered from what we believe are reliable sources. It is not guaranteed as to accuracy, does not purport to be complete and is not intended to be used as a primary basis for investment decisions. It should also not be construed as advice meeting the particular investment needs of any investor. Past performance does not guarantee future results.
Investments in emerging markets may be more volatile and less liquid than investing in developed markets and may involve exposure to economic structures that are generally less diverse and mature and to political systems which have less stability than those of more developed countries.
The performance figures shown are gross of investment advisory fees and other expenses. The deduction of these management fees and expenses would reduce the overall return. Because fees are deducted quarterly, the compounding effect would be to increase the impact of the fee deduction on gross account performance by a greater percentage than that of the annual fee charged. For example, if an account is charged a 1% management fee per year and has gross performance of 12% during that same period, the compounding effect of the quarterly fee assessments will result in an actual return of approximately 10.9%.
Investments in commodities may have greater volatility than investments in traditional securities, particularly if the instruments involve leverage. The value of commodity-linked derivative instruments may be affected by changes in overall market movements, commodity index volatility, changes in interest rates or factors affecting a particular industry or commodity, such as drought, floods, weather, livestock disease, embargoes, tariffs and international economic, political and regulatory developments. Use of leveraged commodity-linked derivatives creates an opportunity for increased return but, at the same time, creates the possibility for greater loss.
Indices are unmanaged and investors cannot invest directly in an index. Unless otherwise noted, performance of indices does not account for any fees, commissions or other expenses that would be incurred. Returns do not include reinvested dividends.
The Standard & Poor's 500 (S&P 500) is an unmanaged group of securities considered to be representative of the stock market in general. It is a market value weighted index with each stock's weight in the index proportionate to its market value.
The Financial Times Stock Exchange 100 Index, also called the FTSE 100 Index, FTSE 100, FTSE, or, informally, the "Footsie" is a share index of the 100 companies listed on the London Stock Exchange with the highest market capitalization. It is seen as a gauge of prosperity for businesses regulated by UK company law.
The FTSE Developed Europe Index is an index of European stocks, part of the FTSE Global Equity Index Series. It is a subset of the FTSE Europe Index. The FTSE Eurobloc Index is a subset of it.
The MSCI Emerging Markets Index is a float-adjusted market capitalization index that consists of indices in 21 emerging economies: Brazil, Chile, China, Colombia, Czech Republic, Egypt, Hungary, India, Indonesia, Korea, Malaysia, Mexico, Morocco, Peru, Philippines, Poland, Russia, South Africa, Taiwan, Thailand, and Turkey.
The Bloomberg Barclays US Aggregate Bond Index, or the Agg, is a broad base, market capitalization-weighted bond market index representing intermediate term investment grade bonds traded in the United States. Investors frequently use the index as a stand-in for measuring the performance of the US bond market.
The US Dollar Index (USDX, DXY) is an index (or measure) of the value of the United States dollar relative to a basket of foreign currencies, often referred to as a basket of US trade partners' currencies.
The Consumer Price Index (CPI) is a measure of inflation compiled by the US Bureau of Labor Studies.
West Texas Intermediate (WTI), also known as Texas light sweet, is a grade of crude oil used as a benchmark in oil pricing. This grade is described as light because of its relatively low density, and sweet because of its low sulfur content.
The Producer Price Index (PPI) is is a family of indexes that measures the average change over time in selling prices received by domestic producers of goods and services. PPIs measure price change from the perspective of the seller.
Market Update: January 16 - 20, 2023

Weekly Summary
After a sharp rally to start the year, the stock market rolled over a little bit last week after economic news was much more negative than expected and bank earnings were weaker than expected. That negative economic data also caused yields to fall again, and the 10-year was all the way down to a five-month low of 3.38% on Wednesday. The Atlanta Fed’s GDPNow measure for the fourth quarter stayed high despite the negative data, and the real-time economic tracker now expects Q4 2022 GDP to show growth of 3.5%.
Economic Data
Both retail sales and the producer price index for December were released on Wednesday and were weaker than expected. December PPI showed prices falling by 0.5% in the month, compared to economist expectations of a 0.1% contraction. While many would have expected this to be a good sign for the stock market as it is yet another sign inflation is falling, it was coupled with poor retail sales data. Retail sales for December fell by 1.1% compared to economist expectations of a 0.8% decline. Stock and bond markets had begun pricing in the potential reality of a soft landing for the Federal Reserve, where growth stays steady but inflation comes down. However, the poor inflation and retail data began to spread some doubt that the soft landing is possible.
Equities
The S&P 500 had a volatile week, with losses of more than 1% to start the week and a gain of 1.86% on Friday. It finished the week lower by 0.27% but is still up 3.5% in 2023. Banks kicked off the earnings season last week, and markets were largely disappointed by their results. Goldman Sachs reported profits that were 66% below last years levels due to a steep decline in investment banking revenues, while Morgan Stanley, Citigroup, and Wells Fargo also reported lower than expected profits. The banks are overwhelmingly expecting a recession later this year, but it is important to keep that in perspective. When stock markets fall, investment banking revenues typically decline by a large amount. Couple that with a decline in home purchases due to the higher mortgage rates and higher housing prices of 2022, and it is no surprise that most banks saw declines in profit last year. United Airlines told a different story, as they have seen more demand than ever and continue to see strong consumer demand for travel during 2023, and their stock is reflecting that strength as the airline is up 33% year-to-date.
Fixed Income
Interest rates continue to be focused on the Federal Reserve and inflation, and the 10-year fell to a five-month low of 3.38% following the PPI release on Wednesday. The 2-year has also had big moves this year, as it has fallen more than 20 basis points to start the year to its current level of 4.22%. The big question in bond markets continues to be whether the Fed has already tightened too much or not. If they have, the fear is that the over-tightening will cause a recession later this year and therefore there is no need to continue increasing rates despite inflation over 6%. Bond markets now have placed a 99% probability on the Fed only increasing rates by 25 basis points in their February meeting, and there is beginning to be a discussion on whether they will increase rates at all in their March meeting.
Commodities
Commodities have been quiet lately, and oil remains lower than it was one year ago. As we get into the first quarter, oil’s inflation input should turn sharply negative, as the first quarter of 2022 contained the Russia and Ukraine war price shock to over $120 a barrel.
Interesting Articles
- WSJ: China’s Shrinking Population is a Deeper Problem Than Slow Growth
- WSJ: Bonds Over Stocks: The New 60-40 Portfolio
- Bloomberg: Economists Says His Indicator That Predicted Eight US Recessions is Wrong This year
All data and figures in this article were collected from YCharts, Inc. on 01/20/2023 by Zach Hill of Blue Ridge Wealth Planners unless otherwise cited.
This material represents an assessment of the market and economic environment at a specific point in time and is not intended to be a forecast of future events, or a guarantee of future results. Forward-looking statements are subject to certain risks and uncertainties. Actual results, performance, or achievements may differ materially from those expressed or implied. Information is based on data gathered from what we believe are reliable sources. It is not guaranteed as to accuracy, does not purport to be complete and is not intended to be used as a primary basis for investment decisions. It should also not be construed as advice meeting the particular investment needs of any investor. Past performance does not guarantee future results.
Investments in emerging markets may be more volatile and less liquid than investing in developed markets and may involve exposure to economic structures that are generally less diverse and mature and to political systems which have less stability than those of more developed countries.
The performance figures shown are gross of investment advisory fees and other expenses. The deduction of these management fees and expenses would reduce the overall return. Because fees are deducted quarterly, the compounding effect would be to increase the impact of the fee deduction on gross account performance by a greater percentage than that of the annual fee charged. For example, if an account is charged a 1% management fee per year and has gross performance of 12% during that same period, the compounding effect of the quarterly fee assessments will result in an actual return of approximately 10.9%.
Investments in commodities may have greater volatility than investments in traditional securities, particularly if the instruments involve leverage. The value of commodity-linked derivative instruments may be affected by changes in overall market movements, commodity index volatility, changes in interest rates or factors affecting a particular industry or commodity, such as drought, floods, weather, livestock disease, embargoes, tariffs and international economic, political and regulatory developments. Use of leveraged commodity-linked derivatives creates an opportunity for increased return but, at the same time, creates the possibility for greater loss.
Indices are unmanaged and investors cannot invest directly in an index. Unless otherwise noted, performance of indices does not account for any fees, commissions or other expenses that would be incurred. Returns do not include reinvested dividends.
The Standard & Poor's 500 (S&P 500) is an unmanaged group of securities considered to be representative of the stock market in general. It is a market value weighted index with each stock's weight in the index proportionate to its market value.
The Financial Times Stock Exchange 100 Index, also called the FTSE 100 Index, FTSE 100, FTSE, or, informally, the "Footsie" is a share index of the 100 companies listed on the London Stock Exchange with the highest market capitalization. It is seen as a gauge of prosperity for businesses regulated by UK company law.
The FTSE Developed Europe Index is an index of European stocks, part of the FTSE Global Equity Index Series. It is a subset of the FTSE Europe Index. The FTSE Eurobloc Index is a subset of it.
The MSCI Emerging Markets Index is a float-adjusted market capitalization index that consists of indices in 21 emerging economies: Brazil, Chile, China, Colombia, Czech Republic, Egypt, Hungary, India, Indonesia, Korea, Malaysia, Mexico, Morocco, Peru, Philippines, Poland, Russia, South Africa, Taiwan, Thailand, and Turkey.
The Bloomberg Barclays US Aggregate Bond Index, or the Agg, is a broad base, market capitalization-weighted bond market index representing intermediate term investment grade bonds traded in the United States. Investors frequently use the index as a stand-in for measuring the performance of the US bond market.
The US Dollar Index (USDX, DXY) is an index (or measure) of the value of the United States dollar relative to a basket of foreign currencies, often referred to as a basket of US trade partners' currencies.
The Consumer Price Index (CPI) is a measure of inflation compiled by the US Bureau of Labor Studies.
West Texas Intermediate (WTI), also known as Texas light sweet, is a grade of crude oil used as a benchmark in oil pricing. This grade is described as light because of its relatively low density, and sweet because of its low sulfur content.
The Producer Price Index (PPI) is is a family of indexes that measures the average change over time in selling prices received by domestic producers of goods and services. PPIs measure price change from the perspective of the seller.
Market Update: January 2 - 6, 2023

Weekly Summary
The story for much of the past year has been the same: markets are concerned about the Federal Reserve, the economy, and inflation. Last week was no different, as Friday’s S&P 500 return of 2.29% pushed the index into positive territory to start the year. The December employment report and ISM Non-Manufacturing surveys were both released, and the stock and bond market both immediately traded on the announcement of that economic data. The December inflation report is released this week, and that will be another very important release for both stock and bond markets going forward. Inflation is expected to continue to slow down, with economists expecting the headline rate to come in at 6.5% year-over-year, down from 7.1% in November.
Economic Data
The December payroll report was supposed to be the highlight of the economic week, as it was released on Friday morning at 8:30am. It was a goldilocks report. Non-farm payrolls beat expectations and came in strong, and the unemployment rate ticked down to 3.5% alongside an increasing labor force participation rate. Those strong numbers also did not translate into higher-than-expected wage growth, which came in weaker than expected at 4.6% year-over-year. This means that the unemployment rate remained strong, but wages slowed down. That should be fantastic news for inflation going forward.
This data was upstaged at 10:00am by an often-overlooked report: the ISM Non-Manufacturing PMI survey. This is a measure of demand in the services sector of the economy, and any reading below 50 indicates a contraction. Economists expected the survey to show growth with a reading of 55, but instead the data showed a contraction at 49.6. While only a mild contraction, this softening of the data caused markets to rally as it immediately was interpreted as good news for inflation.
We will immediately be able to determine if that is true, as inflation is released this Thursday at 8:30am.
Equities
The S&P 500 started the year off strong, returning 1.48% last week off the back of a 2.29% gain on Friday following the economic data release. Stocks actually traded lower after the unemployment data came in relatively strong, but immediately rebounded at 10:00am following the surprisingly weak ISM Non-Manufacturing data. It appears as if the stock and bond markets are taking the “good news is bad news approach.” That means that when data comes out that is relatively strong, markets believe that this is a risk that inflation will stay hot and the Fed will be forced to keep rates higher for longer. If data is weak, markets believe inflation could be softer in the future and the Fed can ease off the gas on future rate hikes. This relationship has held true for the last few months as markets have been hyper-focused on the Federal Reserve and inflation.
Fixed Income
Similar to the S&P 500, fixed income had its entire start to the year determined by the economic releases on Friday. The 10-year spent most of the week hovering between 3.7% and 3.8% only to fall by about 15 basis points after the ISM release on Friday. The 10-year was actually up following the jobs report at 8:30am, but immediately fell at 10:00am when the ISM data was released. The 2-year showed an even more dramatic move, falling by over 20 basis points at one point to end the week at 4.27%. This significant drop in the 2-year interest rate shows that the markets were mostly looking towards the Federal Reserve’s future rate hike path following the economic data.
Commodities
The most interesting story in commodities the last few months has been in natural gas. For much of the past year, there has been significant worries in Europe about a potential natural gas shortage due to the Russian-Ukrainian war. Russia controls the majority of natural gas supply in the European Union, and therefore uses that gas as a political tool to implement its political desires in the bloc. However, this winter has been incredibly warm for much of the world and natural gas demand has been much lower than expected. That has caused the price of natural gas in the US to fall to $3.81/MMBtu from a high of $9.68 towards the end of last summer, a 61% decrease.
Interesting Articles
- WSJ: Hiring, Wage Gains Eased in December
- Byron Wien and Joe Zidle: The Ten Surprises of 2023
- Ben Carlson: You Now Have Options Galore for Yield on Your Savings
All data and figures in this article were collected from YCharts, Inc. on 01/06/2023 by Zach Hill of Blue Ridge Wealth Planners unless otherwise cited.
This material represents an assessment of the market and economic environment at a specific point in time and is not intended to be a forecast of future events, or a guarantee of future results. Forward-looking statements are subject to certain risks and uncertainties. Actual results, performance, or achievements may differ materially from those expressed or implied. Information is based on data gathered from what we believe are reliable sources. It is not guaranteed as to accuracy, does not purport to be complete and is not intended to be used as a primary basis for investment decisions. It should also not be construed as advice meeting the particular investment needs of any investor. Past performance does not guarantee future results.
Investments in emerging markets may be more volatile and less liquid than investing in developed markets and may involve exposure to economic structures that are generally less diverse and mature and to political systems which have less stability than those of more developed countries.
The performance figures shown are gross of investment advisory fees and other expenses. The deduction of these management fees and expenses would reduce the overall return. Because fees are deducted quarterly, the compounding effect would be to increase the impact of the fee deduction on gross account performance by a greater percentage than that of the annual fee charged. For example, if an account is charged a 1% management fee per year and has gross performance of 12% during that same period, the compounding effect of the quarterly fee assessments will result in an actual return of approximately 10.9%.
Investments in commodities may have greater volatility than investments in traditional securities, particularly if the instruments involve leverage. The value of commodity-linked derivative instruments may be affected by changes in overall market movements, commodity index volatility, changes in interest rates or factors affecting a particular industry or commodity, such as drought, floods, weather, livestock disease, embargoes, tariffs and international economic, political and regulatory developments. Use of leveraged commodity-linked derivatives creates an opportunity for increased return but, at the same time, creates the possibility for greater loss.
Indices are unmanaged and investors cannot invest directly in an index. Unless otherwise noted, performance of indices does not account for any fees, commissions or other expenses that would be incurred. Returns do not include reinvested dividends.
The Standard & Poor's 500 (S&P 500) is an unmanaged group of securities considered to be representative of the stock market in general. It is a market value weighted index with each stock's weight in the index proportionate to its market value.
The Financial Times Stock Exchange 100 Index, also called the FTSE 100 Index, FTSE 100, FTSE, or, informally, the "Footsie" is a share index of the 100 companies listed on the London Stock Exchange with the highest market capitalization. It is seen as a gauge of prosperity for businesses regulated by UK company law.
The FTSE Developed Europe Index is an index of European stocks, part of the FTSE Global Equity Index Series. It is a subset of the FTSE Europe Index. The FTSE Eurobloc Index is a subset of it.
The MSCI Emerging Markets Index is a float-adjusted market capitalization index that consists of indices in 21 emerging economies: Brazil, Chile, China, Colombia, Czech Republic, Egypt, Hungary, India, Indonesia, Korea, Malaysia, Mexico, Morocco, Peru, Philippines, Poland, Russia, South Africa, Taiwan, Thailand, and Turkey.
The Bloomberg Barclays US Aggregate Bond Index, or the Agg, is a broad base, market capitalization-weighted bond market index representing intermediate term investment grade bonds traded in the United States. Investors frequently use the index as a stand-in for measuring the performance of the US bond market.
The US Dollar Index (USDX, DXY) is an index (or measure) of the value of the United States dollar relative to a basket of foreign currencies, often referred to as a basket of US trade partners' currencies.
The Consumer Price Index (CPI) is a measure of inflation compiled by the US Bureau of Labor Studies.
West Texas Intermediate (WTI), also known as Texas light sweet, is a grade of crude oil used as a benchmark in oil pricing. This grade is described as light because of its relatively low density, and sweet because of its low sulfur content.
The Consumer Price Index (CPI) is a measure of inflation compiled by the US Bureau of Labor Studies.
The FAO Food Price Index (FFPI) is a measure of the monthly change in international prices of a basket of food commodities. It consists of the average of five commodity group price indices weighted by the average export shares of each of the groups over 2014-2016. The FFPI is calculated as the trade-weighted average of the prices of food commodities spanning the key agricultural markets for cereals, vegetable oils, sugar, meat and dairy products. While these commodities represent about 40 percent of gross agricultural food commodity trade (FAOSTAT), they are chosen for their high and strategic importance in global food security and trade.
2022
Market Update: December 26 - 30, 2022

Economic Indicators
The most closely watch economic indicator of 2022 was easily inflation. Headline CPI started the year at 7% and reached its current cycle high of 9.1% in August. Since then, the price increases of goods, energy, and food have slowed considerably, bringing year over year CPI to 7.1% to end the year. Services inflation will be very closely watched in 2023 as it has yet to show any promising signs of slowing down significantly.
The Unemployment rate is a great barometer for the current health of the economy. In 2022, the unemployment rate fell from 4% to 3.7% and reached a low of 3.5% In July, equal to the lowest unemployment rate since 1969. A heavily cited metric showing the strength of this year’s labor market is the ratio of open jobs to job seekers, which closed the year at 1.7, meaning there are 1.7 open jobs for every one person looking for work. This is very unusual as job seekers have generally outnumbered job seekers over the past 20 years. This will be an important ratio to watch in 2023 as Federal Reserve Chairman, Jerome Powell, has cited the importance of bringing more balance to the job market in order to bring down inflation. In the Fed’s ideal scenario, employers slow hiring without increasing layoffs. This could slow the rapid wage growth we’ve seen this year, with the least amount of pain possible on individual households.
Equities
The S&P 500 was in a drawdown for the entire year, achieving its most recent all time high on January 3, 2022. The index reached a low of 24.5% in October and ending the year down 18.2%. The tech heavy NASDAQ 100 experienced steeper losses, ending the year 33.4% off its all-time high. Small cap stocks fared slightly better with the Russell 2000 ending the year 26.9% off its all-time high. The Energy sector achieved a historic year, gaining an astounding 64.2% in 2022. The Utilities sector was the only other sector to post positive returns in 2022, with just a 1.4% return.
The companies with the largest market caps that seemingly outperformed nearly every other asset class over the past 10 years had a very rough year. Some notable losers in 2022 were Tesla (-65%), Meta (-64%), Netflix (-51%), and Amazon (-50%). Apple, Microsoft, and Alphabet (Google’s parent company) are the only remaining companies that still have a market cap over a trillion dollars after 2022.
Fixed Income
The Federal Reserve hiked interest rates at the fastest pace since the 1980s, raising rates 17 times (counting each 25bps increase as a rate hike). The upper limit for the target federal funds rate sits at 4.5% after starting the year at just 0.25%. The Fed hiked rates 75bps in four of their seven meetings and ended the year less aggressively with a 50bps hike. Markets currently expect the Fed to slow down even more and hike only 25bps in February. In their last meeting, the Fed signaled that they expect the fed funds rate to get as high as 5.1% in 2023, however, markets are pricing in either fewer hikes or rate cuts at the end of the year. Forecasting the Fed’s moves over the next year is very difficult as it really depends on what inflation will do. If inflation comes in hotter than expected next year the Fed will most certainly consider raising rates much higher than 5%. If the unemployment rate rises significantly and inflation falls in a meaningful way, they may consider bringing the federal funds rate below its current level.
The rapid increase in interest rates this year had a huge effect on mortgage rates. The 30-year fixed mortgage rate started the year at just 3.2%, reached a high of 7.1% in August, and closed the year slightly lower at 6.4%. The increase in mortgage rates was likely a large factor the slowdown of the extremely hot housing market. After increasing nearly 22% earlier in the year, housing prices, measured by the Case-Schiller Composite 20 index, ended the year up a more modest 8.7%, still much faster than the 5.3% long term average.
Interest rates and bond prices have an inverse relationship; rapid increases in interest rates means rapid decreases in bond prices. The tightening of monetary conditions this year equates to a horrible year for bonds, which fell 13% in 2022 and remain 14.9% off their all-time high set nearly two and a half years ago. The silver lining of this bond drawdown is risk free assets now pay a much more attractive dividend. A two-year treasury rate now yields 4.36%, compared to just 0.74% at the beginning of the year.
Bond prices next year will depend on inflation and the economy. If inflation stays high the Fed will likely stay aggressive and bonds will suffer. If the U.S. enters a severe recession and the Fed is forced to cut rates, bonds will perform well. The Fed began 2022 believing it would only increase interest rates about four times, to an end-year rate of 0.9%. This shows how quickly things can change in a short amount of time, so the current market expectations of the Fed will be dependent on their ability to keep inflation heading in the right direction.
Commodities
Despite incredibly high uncertainty surrounding the supply of oil coming from Russia, the second largest oil exporter in the world, along with heavy sanctions and OPEC production cuts, the price of oil ended the year up just 2.8%. Crude Oil reached an annual high of $123.70 in March following Russian’s invasion of Ukraine but closed the year at just $79.28 a barrel. This directly correlates to the price of gas we pay at the pump. The average U.S. gas price per gallon got as high as $5.11 in June, higher than the previous all time high of $4.17 in 2008. Today, the national average is just $3.20 a gallon.
Wheat and natural gas showed very similar price movements to oil in 2022 as markets reacted very strongly to Russian’s invasion and then adjusted throughout the year to much more normal levels. The price of wheat reached a high of $12.94 a bushel in March, increasing 66% in just over two months. It fell to $7.92 to end the year. The World Food Price Index experienced similar declines, falling 15% from its 2022 high to end the year. European natural gas was the most affected by the Russia Ukraine war as Europe gets about a third of its gas from Russia. The Price of European Natural Gas increased 341% from January to August 2022. It fell nearly 80% from its peak, but still remains four times higher than its 2020 year-end price.
Next year, the war in Ukraine will remain a very important catalyst to commodity prices. As of now, Russia has been able to find alternate buyers to get around sanctions, and Europe has been able to stock up on enough natural gas to likely get through the winter. Any developments in the war that disrupt supply and force sanctions to tighten will surely affect the price of the commodities listed above.
Interesting Articles
- Caitlin McCabe: For U.S. Stocks, 2022 Is a Year With Almost No Record Highs
- Ben Carlson: 2022 Was One of the Worst Years Ever For Markets
All data and figures in this article were collected from YCharts, Inc. on 01/03/2023 by Zach Hill of Blue Ridge Wealth Planners unless otherwise cited.
This material represents an assessment of the market and economic environment at a specific point in time and is not intended to be a forecast of future events, or a guarantee of future results. Forward-looking statements are subject to certain risks and uncertainties. Actual results, performance, or achievements may differ materially from those expressed or implied. Information is based on data gathered from what we believe are reliable sources. It is not guaranteed as to accuracy, does not purport to be complete and is not intended to be used as a primary basis for investment decisions. It should also not be construed as advice meeting the particular investment needs of any investor. Past performance does not guarantee future results.
Investments in emerging markets may be more volatile and less liquid than investing in developed markets and may involve exposure to economic structures that are generally less diverse and mature and to political systems which have less stability than those of more developed countries
The performance figures shown are gross of investment advisory fees and other expenses. The deduction of these management fees and expenses would reduce the overall return. Because fees are deducted quarterly, the compounding effect would be to increase the impact of the fee deduction on gross account performance by a greater percentage than that of the annual fee charged. For example, if an account is charged a 1% management fee per year and has gross performance of 12% during that same period, the compounding effect of the quarterly fee assessments will result in an actual return of approximately 10.9%.
Investments in commodities may have greater volatility than investments in traditional securities, particularly if the instruments involve leverage. The value of commodity-linked derivative instruments may be affected by changes in overall market movements, commodity index volatility, changes in interest rates or factors affecting a particular industry or commodity, such as drought, floods, weather, livestock disease, embargoes, tariffs and international economic, political and regulatory developments. Use of leveraged commodity-linked derivatives creates an opportunity for increased return but, at the same time, creates the possibility for greater loss.
Indices are unmanaged and investors cannot invest directly in an index. Unless otherwise noted, performance of indices does not account for any fees, commissions or other expenses that would be incurred. Returns do not include reinvested dividends.
The Standard & Poor's 500 (S&P 500) is an unmanaged group of securities considered to be representative of the stock market in general. It is a market value weighted index with each stock's weight in the index proportionate to its market value.
The Financial Times Stock Exchange 100 Index, also called the FTSE 100 Index, FTSE 100, FTSE, or, informally, the "Footsie" is a share index of the 100 companies listed on the London Stock Exchange with the highest market capitalization. It is seen as a gauge of prosperity for businesses regulated by UK company law.
The FTSE Developed Europe Index is an index of European stocks, part of the FTSE Global Equity Index Series. It is a subset of the FTSE Europe Index. The FTSE Eurobloc Index is a subset of it.
The MSCI Emerging Markets Index is a float-adjusted market capitalization index that consists of indices in 21 emerging economies: Brazil, Chile, China, Colombia, Czech Republic, Egypt, Hungary, India, Indonesia, Korea, Malaysia, Mexico, Morocco, Peru, Philippines, Poland, Russia, South Africa, Taiwan, Thailand, and Turkey.
The Bloomberg Barclays US Aggregate Bond Index, or the Agg, is a broad base, market capitalization-weighted bond market index representing intermediate term investment grade bonds traded in the United States. Investors frequently use the index as a stand-in for measuring the performance of the US bond market.
The US Dollar Index (USDX, DXY) is an index (or measure) of the value of the United States dollar relative to a basket of foreign currencies, often referred to as a basket of US trade partners' currencies.
The Consumer Price Index (CPI) is a measure of inflation compiled by the US Bureau of Labor Studies.
West Texas Intermediate (WTI), also known as Texas light sweet, is a grade of crude oil used as a benchmark in oil pricing. This grade is described as light because of its relatively low density, and sweet because of its low sulfur content.
The Consumer Price Index (CPI) is a measure of inflation compiled by the US Bureau of Labor Studies.
The FAO Food Price Index (FFPI) is a measure of the monthly change in international prices of a basket of food commodities. It consists of the average of five commodity group price indices weighted by the average export shares of each of the groups over 2014-2016. The FFPI is calculated as the trade-weighted average of the prices of food commodities spanning the key agricultural markets for cereals, vegetable oils, sugar, meat and dairy products. While these commodities represent about 40 percent of gross agricultural food commodity trade (FAOSTAT), they are chosen for their high and strategic importance in global food security and trade.
Market Update: December 12 - 16, 2022

Economic Data Last Week
U.S. CPI1
On Tuesday, the Bureau of Labor Statistics reported CPI increasing 7.1% year over year in November. This was lower than the consensus estimate of 7.3%, and far lower than the current cycle high of 9.1% reported in June. Year over year inflation has not been lower than 7.1% since December of 2021. After stripping out volatile items, Core CPI also came in below expectations at 6%, its lowest level since July.
Food, energy, and shelter continue to experience the biggest price increases, increasing 10.6%, 13.1%, and 7.1% year over year in November, respectively. However, both food and energy price increases are below their current cycle highs set earlier in the year. Energy prices had increased nearly 42% in June, while Food price increases reached their high in August with an 11.3% increase. Shelter, on the other hand, set a new cycle high this past report. Shelter is an important component of CPI as it makes up about a third of the index. However, several independent reports show rent and housing price increases beginning to slow. Zillow’s Observed Rent Index shows rents increasing 8.4% year over year in November, down from its high of 17% reported in February.2 The Case-Shiller 20 Composite Index, which measures the value of residential real estate in 20 U.S. metropolitan areas, increased 10.5% in September, down from its high of 21.3% in April. The CPI component of shelter tends to work on a lag. So, the decreases we are seeing in housing prices and rent are likely not yet reflected in the still increasing shelter component of CPI. This is a strong argument for CPI to continue to show slowing price increases in future reports.
Looking at alternate measures of inflation, the Cleveland Fed’s Trimmed Mean CPI, which takes away the most extreme values of inflation, fell to 6.7%, down from its current cycle high of 7.3% in September.3 The Sticky-Price CPI shows how much prices have changed year over a year for products with prices that are generally very slow and difficult to update. A high Sticky-Price CPI can show that long term inflation expectations are rising. Sticky-Price CPI was reported at 6.6% last week, higher than last month’s value of 6.5% and a new current cycle high.4
Both Germany and the UK reported slowing inflation from the previous month. Germany’s prices increased 10% year over year, while the UK reported price increases of 10.7%.
Retail Sales5
U.S. Retail Sales fell 0.6% month over month in November, the largest decrease of the year. This implies a slowdown in sales this holiday season, which is consistent with the slowdown in holiday retail hiring this year compared to previous years.
GDP Now is a statistical estimate of quarterly GDP provided by the Atlanta Federal Reserve. Despite the low retail sales numbers, it still estimates fourth quarter GDP to grow by an annualized rate of 2.8%, which is slightly below the long-term average of 3.2%.6
Equities
The S&P 500 fell 2.1% last week; it is now 18.5% off its all-time high set at the beginning of the year. The index is down 5.5% in December but is still up 7.8% in the fourth quarter to date.
The Energy sector will most certainly end the year with the best returns as it is up 56.7% year to date. The Utilities sector has the next best returns of the year with just 0.6%. The more cyclical sectors experienced the steepest losses on the year, with the Communications and the Consumer Discretionary sectors both down over 30% year to date.
Fixed Income
The Federal Reserve met last Wednesday and agreed to raise the target Federal Funds rate by 50bps after raising by 75bps four meetings in a row, bringing the upper limit of the target Federal Funds rate to 4.5%. They also outlined their projections for interest rates over the next several years. Their estimated Federal Funds rate in 2023 is just above 5%. Their estimates for 2024 vary quite a bit, but the consensus estimate for the Federal Funds rate is just above 4%. These estimates can of course change at any time, but they currently imply that the Fed expects two 25bps rate hikes in 2023, and then rate cuts in 2024.7
In order for the Fed to consider cutting interest rates, they will likely need to see both inflation and economic activity slow considerably. This is also outlined in their Summary of Economic Projections. They estimate GDP to increase by just 0.5% in 2023, down considerably from their September estimate where they projected GDP to grow by 1.2% in 2023. They project inflation, measured by the PCE price index, to increase 3.1% in 2023 and then 2.5% in 2024. The PCE price index recently increased 6% year over year and the Federal Reserve’s long run target remains at 2%.
What to Watch for This Week
- The PCE price index will be released on Friday. Core PCE is expected to increase 4.7% year over year, down from the 5% reported in October.
- Canada and Japan will release inflation numbers next week.
Interesting Articles
- Matthew Zeitlin: Why does good news about the economy sound bad to the Fed?
- Barry Ritholtz: What the Fed Gets Wrong
References
- Bureau of Labor Statistics: Consumer Price Index Summary
- Zillow: Housing Data
- Federal Reserve Bank of Cleveland: Median CPI
- Federal Reserve Bank of Atlanta: Sticky-Price CPI
- United States Census Bureau: Advanced Monthly Sales, November 2022
- Federal Reserve Bank of Atlanta: GDP Now
- Federal Reserve: Summary of Economic Projections
All data and figures in this article were collected from YCharts, Inc. on 12/19/2022 by Zach Hill of Blue Ridge Wealth Planners unless otherwise cited.
This material represents an assessment of the market and economic environment at a specific point in time and is not intended to be a forecast of future events, or a guarantee of future results. Forward-looking statements are subject to certain risks and uncertainties. Actual results, performance, or achievements may differ materially from those expressed or implied. Information is based on data gathered from what we believe are reliable sources. It is not guaranteed as to accuracy, does not purport to be complete and is not intended to be used as a primary basis for investment decisions. It should also not be construed as advice meeting the particular investment needs of any investor. Past performance does not guarantee future results.
Investments in emerging markets may be more volatile and less liquid than investing in developed markets and may involve exposure to economic structures that are generally less diverse and mature and to political systems which have less stability than those of more developed countries
The performance figures shown are gross of investment advisory fees and other expenses. The deduction of these management fees and expenses would reduce the overall return. Because fees are deducted quarterly, the compounding effect would be to increase the impact of the fee deduction on gross account performance by a greater percentage than that of the annual fee charged. For example, if an account is charged a 1% management fee per year and has gross performance of 12% during that same period, the compounding effect of the quarterly fee assessments will result in an actual return of approximately 10.9%.
Investments in commodities may have greater volatility than investments in traditional securities, particularly if the instruments involve leverage. The value of commodity-linked derivative instruments may be affected by changes in overall market movements, commodity index volatility, changes in interest rates or factors affecting a particular industry or commodity, such as drought, floods, weather, livestock disease, embargoes, tariffs and international economic, political and regulatory developments. Use of leveraged commodity-linked derivatives creates an opportunity for increased return but, at the same time, creates the possibility for greater loss.
Indices are unmanaged and investors cannot invest directly in an index. Unless otherwise noted, performance of indices does not account for any fees, commissions or other expenses that would be incurred. Returns do not include reinvested dividends.
The Standard & Poor's 500 (S&P 500) is an unmanaged group of securities considered to be representative of the stock market in general. It is a market value weighted index with each stock's weight in the index proportionate to its market value.
The Financial Times Stock Exchange 100 Index, also called the FTSE 100 Index, FTSE 100, FTSE, or, informally, the "Footsie" is a share index of the 100 companies listed on the London Stock Exchange with the highest market capitalization. It is seen as a gauge of prosperity for businesses regulated by UK company law.
The FTSE Developed Europe Index is an index of European stocks, part of the FTSE Global Equity Index Series. It is a subset of the FTSE Europe Index. The FTSE Eurobloc Index is a subset of it.
The MSCI Emerging Markets Index is a float-adjusted market capitalization index that consists of indices in 21 emerging economies: Brazil, Chile, China, Colombia, Czech Republic, Egypt, Hungary, India, Indonesia, Korea, Malaysia, Mexico, Morocco, Peru, Philippines, Poland, Russia, South Africa, Taiwan, Thailand, and Turkey.
The Bloomberg Barclays US Aggregate Bond Index, or the Agg, is a broad base, market capitalization-weighted bond market index representing intermediate term investment grade bonds traded in the United States. Investors frequently use the index as a stand-in for measuring the performance of the US bond market.
The US Dollar Index (USDX, DXY) is an index (or measure) of the value of the United States dollar relative to a basket of foreign currencies, often referred to as a basket of US trade partners' currencies.
The Consumer Price Index (CPI) is a measure of inflation compiled by the US Bureau of Labor Studies.
West Texas Intermediate (WTI), also known as Texas light sweet, is a grade of crude oil used as a benchmark in oil pricing. This grade is described as light because of its relatively low density, and sweet because of its low sulfur content.
The PCE price index (PCEPI), also referred to as the PCE deflator, PCE price deflator, or the Implicit Price Deflator for Personal Consumption Expenditures (IPD for PCE) by the BEA, and as the Chain-type Price Index for Personal Consumption Expenditures (CTPIPCE) by the Federal Open Market Committee (FOMC), is a United States-wide indicator of the average increase in prices for all domestic personal consumption. It is benchmarked to a base of 2012 = 100. Using a variety of data including U.S. Consumer Price Index and Producer Price Index prices, it is derived from the largest component of the GDP in the BEA's National Income and Product Accounts, personal consumption expenditures.
The Zillow Observed Rent Index (ZORI) is a smoothed measure of the typical observed market rate rent across a given region. ZORI is a repeat-rent index that is weighted to the rental housing stock to ensure representativeness across the entire market, not just those homes currently listed for-rent. The index is dollar-denominated by computing the mean of listed rents that fall into the 40th to 60th percentile range for all homes and apartments in a given region, which is once again weighted to reflect the rental housing stock.
The S&P CoreLogic Case–Shiller Home Price Indices are repeat-sales house price indices for the United States. There are multiple Case–Shiller home price indices: A national home price index, a 20-city composite index, a 10-city composite index, and twenty individual metro area indices. These indices were first produced commercially by Case Shiller Weiss. They are now calculated and kept monthly by Standard & Poor's, with data calculated for January 1987 to present. The indices kept by Standard & Poor are normalized to a value of 100 in January 2000
Market Update: December 5 - 9, 2022

Economic Data Last Week
U.S. Producer Price Index1
The Producer Price index, which measures price changes at the wholesale level, increased slightly more than expected in November. The index increased 0.3%, compared to the consensus estimate of 0.2%. The year over year change in producer prices was reported at 7.4%, far below its current cycle high of 11.5% reported in March.
Despite the slightly higher than expected increase in producer prices last month, several other indicators have pointed to inflation finally slowing down. Some of the biggest factors contributing to inflation this past year have been food, energy, used cars and rent. Global food prices have fallen drastically since the initial invasion of Ukraine, measured by the World Food Price Index, which is down 15% since March.2 Additionally, the price of wheat has fallen over 40% since its historic run up earlier in the year. After reaching a high of $124 a barrel in March, WTI Crude Oil has fallen over 40% to just above $70 a barrel today. Meanwhile, the average price paid for a gallon of gasoline in the U.S. is just $3.50 after achieving a record high $5.12 in June. After increasing considerably, used car prices are finally decreasing steadily. The Manheim Used Vehicle Value index is down over 14% year over year.3 Rent prices have been a little more stubborn, but still show signs of slowing as the cost of renting a home increased 7.8% in October, its slowest pace in over a year and well below its year to date high of 17.5% reported in March.4
Equities
The S&P 500 fell in four out of the five days last week, ending the week down 3.4%. The index is currently up 10.1% in the fourth quarter. If the S&P 500 ends up finishing the fourth quarter higher, it will be the first positive quarter since the fourth quarter of 2021.
When compared to very recent history, this has been an unusually long drawdown as it has been 236 trading days since the last all-time high on January 3. Since then, year over year inflation reached a 40-year high of 9.1% and the Federal Reserve increased interest rates from 0.25% to 4.0%, which is 16 rate hikes in a typical hiking cycle. At its lowest level of the year, the S&P 500 was down 24.5% and is currently 16.7% off its high. During the two most recent stock market drawdowns, in 2020 and in 2018, equity markets found new all-time highs in just 125 and 145 trading days respectively. However, the number of trading days between all-time highs experienced this year is a fraction of what was experienced in the Dot Com Bubble and the Great Financial Crisis. There were 1,375 trading days between all-time highs during the bear market following the Great Recession in 2007, and there were 1,802 trading days between all-time highs following the bursting of the Dot Com Bubble in 2000.
The peaks and troughs experienced during this bear market have closely tracked inflation expectations and therefore have been tied to expectations surrounding the Federal Reserve’s interest rate increases. The end of the current drawdown, absent a major geopolitical shock, likely relies on getting inflation under control and slowing the pace of rate hikes or stopping them all together. Therefore, the next several CPI reports, including the upcoming report on December 13 will be very important for equity returns.
Fixed Income
Interest rates remained relatively stable ahead of the Federal Reserve’s meeting next week with neither the short nor long end of the curve changing too much. However, interest rates remain well below their current cycle highs. The ten-year Treasury rate is currently trading at 3.57%, well below its level of 4.23% in late October. The two-year Treasury rate is currently trading at 4.33%, after trading as high as 4.73% at the beginning of November. This drop in yields has made for a great quarter to be in invested in bonds with the U.S. Aggregate Bond index gaining 3.85% in the fourth quarter to date. If the quarter were to end today, this would be the best quarter for bonds since 2011. Still, the U.S. Aggregate Bond Index is 13% off its all-time high set in August of 2020, with a record 27-month drawdown.
The Federal Reserve is still expected to hike just 50bps in their meeting this week. This will be the first 50bps rate increase since May following four 75bps hikes in a row. The Fed will also release an updated Summary of Economic Projections, outlining their estimates on interest rates and economic data for the next few years.
What to Watch for This Week
- U.S. CPI will be reported on Wednesday. Economists expect month over month inflation to fall to 0.3%, after being reported at 0.4% in both September and October. The year over year rate is expected to fall to 7.3%.
- The Federal Reserve meets on Thursday to determine the new target federal funds rate. They are expected to raise rates by 50bps, the smallest rate hike since May. This would bring the upper limit of the federal fund rate to 4.5%.
- The Bank of England and the European Central Bank will also meet this week to make interest rate decisions.
- U.S. Retail Sales will be reported on Thursday, the consensus estimate is for a month over month decrease of 0.1% after increasing 1.3% in October.
- The Euro Area, UK, and France all release their inflation data this week.
Interesting Articles
- Christopher Mims: Survival Lessons From Past Tech Downturns
- Jeff Sommer: After a Terrible Year for Bonds, the Outlook Is Better
References
- Bureau of Labor Statistics: Producer Price Index News Release Summary
- Trading Economics: World Food Price Index
- Manheim Used Vehicle Value Index
- Redfin: Rental Market Tracker
All data and figures in this article were collected from YCharts, Inc. on 12/12/2022 by Colin Bohne of Blue Ridge Wealth Planners unless otherwise cited.
This material represents an assessment of the market and economic environment at a specific point in time and is not intended to be a forecast of future events, or a guarantee of future results. Forward-looking statements are subject to certain risks and uncertainties. Actual results, performance, or achievements may differ materially from those expressed or implied. Information is based on data gathered from what we believe are reliable sources. It is not guaranteed as to accuracy, does not purport to be complete and is not intended to be used as a primary basis for investment decisions. It should also not be construed as advice meeting the particular investment needs of any investor. Past performance does not guarantee future results.
Investments in emerging markets may be more volatile and less liquid than investing in developed markets and may involve exposure to economic structures that are generally less diverse and mature and to political systems which have less stability than those of more developed countries.
The performance figures shown are gross of investment advisory fees and other expenses. The deduction of these management fees and expenses would reduce the overall return. Because fees are deducted quarterly, the compounding effect would be to increase the impact of the fee deduction on gross account performance by a greater percentage than that of the annual fee charged. For example, if an account is charged a 1% management fee per year and has gross performance of 12% during that same period, the compounding effect of the quarterly fee assessments will result in an actual return of approximately 10.9%.
Investments in commodities may have greater volatility than investments in traditional securities, particularly if the instruments involve leverage. The value of commodity-linked derivative instruments may be affected by changes in overall market movements, commodity index volatility, changes in interest rates or factors affecting a particular industry or commodity, such as drought, floods, weather, livestock disease, embargoes, tariffs and international economic, political and regulatory developments. Use of leveraged commodity-linked derivatives creates an opportunity for increased return but, at the same time, creates the possibility for greater loss.
Indices are unmanaged and investors cannot invest directly in an index. Unless otherwise noted, performance of indices does not account for any fees, commissions or other expenses that would be incurred. Returns do not include reinvested dividends.
The Standard & Poor's 500 (S&P 500) is an unmanaged group of securities considered to be representative of the stock market in general. It is a market value weighted index with each stock's weight in the index proportionate to its market value.
The Financial Times Stock Exchange 100 Index, also called the FTSE 100 Index, FTSE 100, FTSE, or, informally, the "Footsie" is a share index of the 100 companies listed on the London Stock Exchange with the highest market capitalization. It is seen as a gauge of prosperity for businesses regulated by UK company law.
The FTSE Developed Europe Index is an index of European stocks, part of the FTSE Global Equity Index Series. It is a subset of the FTSE Europe Index. The FTSE Eurobloc Index is a subset of it.
The MSCI Emerging Markets Index is a float-adjusted market capitalization index that consists of indices in 21 emerging economies: Brazil, Chile, China, Colombia, Czech Republic, Egypt, Hungary, India, Indonesia, Korea, Malaysia, Mexico, Morocco, Peru, Philippines, Poland, Russia, South Africa, Taiwan, Thailand, and Turkey.
The Bloomberg Barclays US Aggregate Bond Index, or the Agg, is a broad base, market capitalization-weighted bond market index representing intermediate term investment grade bonds traded in the United States. Investors frequently use the index as a stand-in for measuring the performance of the US bond market.
The US Dollar Index (USDX, DXY) is an index (or measure) of the value of the United States dollar relative to a basket of foreign currencies, often referred to as a basket of US trade partners' currencies.
The Producer Price Index (PPI) is a family of indexes that measures the average change in selling prices received by domestic producers of goods and services over time. PPIs measure price change from the perspective of the seller.
The Consumer Price Index (CPI) is a measure of inflation compiled by the US Bureau of Labor Studies.
The FAO Food Price Index (FFPI) is a measure of the monthly change in international prices of a basket of food commodities. It consists of the average of five commodity group price indices weighted by the average export shares of each of the groups over 2014-2016. The FFPI is calculated as the trade-weighted average of the prices of food commodities spanning the key agricultural markets for cereals, vegetable oils, sugar, meat and dairy products. While these commodities represent about 40 percent of gross agricultural food commodity trade (FAOSTAT), they are chosen for their high and strategic importance in global food security and trade.
West Texas Intermediate (WTI), also known as Texas light sweet, is a grade of crude oil used as a benchmark in oil pricing. This grade is described as light because of its relatively low density, and sweet because of its low sulfur content.
Market Update: November 28 - December 2, 2022

Economic Data Last Week
Payroll Report1
The Bureau of Labor Statistics released the payroll report for November on Friday. It showed nonfarm payrolls increasing by 263,000 in November, more than the 200,000 expected by analysts. The unemployment rate remained at 3.7%, while the participation rate fell slightly to 62.1%, below its pre-pandemic level of 63.4%.
The payroll report has been one of the most important reports to watch as inflation remains high. The Federal Reserve has cited the importance of cooling the labor market in order to bring inflation down. There are still over ten million job openings and only six million job seekers. This imbalance leads to strong wage gains that force companies to increases prices to protect their profit margins. Those price increases then cause employees to seek more wage gains to compensate them for the higher costs of living, potentially created an inflationary spiral. Wages increased 5.1% year over year in November, much faster than the consensus estimate of 4.6% and the long-term average of 2.9%. Wages increased 0.6% from October to November, this is the fastest monthly increase since January of this year.
Another interesting take away from the payroll report is the slowdown in holiday season retail hiring this year. Typically, retailers increase their hiring in October through December to account for increased holiday traffic. In October and November of this year, only 419,000 workers have been hired in the retail space, the lowest amount in these two months since 2009 and nearly 20% fewer than this time last year. A slowdown in retail hiring signals that companies don’t expect this holiday season to be as busy as past years.
Personal Consumption Expenditures Price Index2
The Fed’s preferred inflation index showed prices rising 6.0% year over year in October, down from last month’s reading of 6.3%, and below its current cycle high of 7.0%
Inflation also showed promising signs of slowing globally, with the Euro Area reporting year over year inflation of 10%, below last month’s report of 10.6%. This is the first time the Eurozone has reported a decrease in year over year inflation in 17 months.
Equities
The S&P 500 ended the week up a little over 1%, with most of the gains coming after Fed Chairman, Jerome Powell, hinted at plans to slow rate hikes to 50bps in their December visit. The S&P 500 is up 13.9% in the fourth quarter and is now just 13.8% off its year-to-date high set on January 3, 2022.
Earnings season is nearly over, with only a few companies left to report third quarter earnings. The third quarter blended earnings growth rate is just 2.5%, its lowest level since 2020. While earnings were negatively affected by rising costs, revenues remain robust as corporations continue to increase their prices. The blended revenue growth rate for the third quarter is 10.9%, this will mark the seventh straight quarter that the S&P 500 has reported revenue growth above 10%.3
Fixed Income
Between the jobs report and Jerome Powell’s comments, interest rates had a volatile week. The two-year Treasury rate ended the week down nearly 20bps while the 10-year rate fell 16bps. The U.S. Aggregate Bond index is up 3.8% in the fourth quarter and is 13.1% off its all-time-high set in August 2020.
After a stronger than expected jobs report, interest rates increased in anticipation of the Federal Reserve being forced to hike more aggressively amid faster wage growth than expected. However, it seems this fear dwindled towards the end of the day as Treasury rates fell to more reasonable levels. Markets still overwhelmingly favor a 50bps hike in the Fed’s December visit.
The yield curve remains severely inverted, with the 10-2 spread ending the week at -0.77%, the deepest inversion since 1981. With an aggressive Federal Reserve, this inversion signals that markets believe that rates are higher today than they will be in the future. The likely reasoning behind this belief is that the Fed will hike the U.S. economy into a recession to bring down inflation. The Fed will then be forced to cut rates to stimulate growth. Powell has made several comments the past few weeks claiming that the risk of not hiking enough is far greater than the risk of hiking too much. If the Fed hikes too much, they can always cut rates. However, if they fail to hike enough and inflation gets out of control, their options are much more limited.
What to Watch for This Week
- U.S. Producer Price Index will be released on Friday, producer prices are expected to increase 0.2% in November, equal to the increase in October.
- The first estimate of the University of Michigan’s Consumer Sentiment index will be released on Friday, it is estimated that the index will increase slightly to 56.9. Its current cycle low was 50 in June.
- The Bank of Canada meets for an interest rate decision this week, they are expected to hike 50bps.
Interesting Articles
- James Bullard: Reflections on Monetary Policy in 2022
- Clare Toeniskoetter: Meet the Man on a Mission to Expose Sneaky Price Increases
References
- Bureau of Labor Statistics: Economic Situation – November 2022
- Bureau of Economic Research : Personal Income and Outlays, October 2022
- Factset Earnings Insight
All data and figures in this article were collected from YCharts, Inc. on 12/5/2022 by Colin Bohne of Blue Ridge Wealth Planners unless otherwise cited.
This material represents an assessment of the market and economic environment at a specific point in time and is not intended to be a forecast of future events, or a guarantee of future results. Forward-looking statements are subject to certain risks and uncertainties. Actual results, performance, or achievements may differ materially from those expressed or implied. Information is based on data gathered from what we believe are reliable sources. It is not guaranteed as to accuracy, does not purport to be complete and is not intended to be used as a primary basis for investment decisions. It should also not be construed as advice visit the particular investment needs of any investor. Past performance does not guarantee future results.
Investments in emerging markets may be more volatile and less liquid than investing in developed markets and may involve exposure to economic structures that are generally less diverse and mature and to political systems which have less stability than those of more developed countries.
The performance figures shown are gross of investment advisory fees and other expenses. The deduction of these management fees and expenses would reduce the overall return. Because fees are deducted quarterly, the compounding effect would be to increase the impact of the fee deduction on gross account performance by a greater percentage than that of the annual fee charged. For example, if an account is charged a 1% management fee per year and has gross performance of 12% during that same period, the compounding effect of the quarterly fee assessments will result in an actual return of approximately 10.9%.
Investments in commodities may have greater volatility than investments in traditional securities, particularly if the instruments involve leverage. The value of commodity-linked derivative instruments may be affected by changes in overall market movements, commodity index volatility, changes in interest rates or factors affecting a particular industry or commodity, such as drought, floods, weather, livestock disease, embargoes, tariffs and international economic, political and regulatory developments. Use of leveraged commodity-linked derivatives creates an opportunity for increased return but, at the same time, creates the possibility for greater loss.
Indices are unmanaged and investors cannot invest directly in an index. Unless otherwise noted, performance of indices does not account for any fees, commissions or other expenses that would be incurred. Returns do not include reinvested dividends.
The Standard & Poor's 500 (S&P 500) is an unmanaged group of securities considered to be representative of the stock market in general. It is a market value weighted index with each stock's weight in the index proportionate to its market value.
The Financial Times Stock Exchange 100 Index, also called the FTSE 100 Index, FTSE 100, FTSE, or, informally, the "Footsie" is a share index of the 100 companies listed on the London Stock Exchange with the highest market capitalization. It is seen as a gauge of prosperity for businesses regulated by UK company law.
The FTSE Developed Europe Index is an index of European stocks, part of the FTSE Global Equity Index Series. It is a subset of the FTSE Europe Index. The FTSE Eurobloc Index is a subset of it.
The MSCI Emerging Markets Index is a float-adjusted market capitalization index that consists of indices in 21 emerging economies: Brazil, Chile, China, Colombia, Czech Republic, Egypt, Hungary, India, Indonesia, Korea, Malaysia, Mexico, Morocco, Peru, Philippines, Poland, Russia, South Africa, Taiwan, Thailand, and Turkey.
The Bloomberg Barclays US Aggregate Bond Index, or the Agg, is a broad base, market capitalization-weighted bond market index representing intermediate term investment grade bonds traded in the United States. Investors frequently use the index as a stand-in for measuring the performance of the US bond market.
The US Dollar Index (USDX, DXY) is an index (or measure) of the value of the United States dollar relative to a basket of foreign currencies, often referred to as a basket of US trade partners' currencies.
The Producer Price Index (PPI) is a family of indexes that measures the average change in selling prices received by domestic producers of goods and services over time. PPIs measure price change from the perspective of the seller.
The Consumer Price Index (CPI) is a measure of inflation compiled by the US Bureau of Labor Studies.
The U of M Consumer Sentiment Index is a survey of consumer confidence conducted by the University of Michigan and Thompson Reuters. The Michigan Consumer Sentiment Index (MCSI) uses telephone surveys to gather information on consumer expectations regarding the overall economy.
The PCE price index (PCEPI), also referred to as the PCE deflator, PCE price deflator, or the Implicit Price Deflator for Personal Consumption Expenditures (IPD for PCE) by the BEA, and as the Chain-type Price Index for Personal Consumption Expenditures (CTPIPCE) by the Federal Open Market Committee (FOMC), is a United States-wide indicator of the average increase in prices for all domestic personal consumption. It is benchmarked to a base of 2012 = 100. Using a variety of data including U.S. Consumer Price Index and Producer Price Index prices, it is derived from the largest component of the GDP in the BEA's National Income and Product Accounts, personal consumption expenditures.
Market Update: November 14 - 18, 2022

Economic Data Last Week
Producer Price Index1
The Producer Price Index (PPI) measures price inflation at the wholesale level; it is the average change in prices over time that U.S. producers receive for their output. This generally feeds through to the Consumer Price Index (CPI), that measures the inflation that the consumers actually experience. The PPI report was similar to the CPI report last week showing inflation decelerating more than expected. Producer prices grew 8% year over year, far below its current cycle high of 11.5% reported in March, and below the consensus estimate of 8.3%. Core PPI, which strips out the more volatile items, increased at 6.7% year over year, also below the consensus estimate of 7.2%. This is an overall great report and another sign that the worst of inflation may be behind us.
U.S. Retail Sales2
The October Retail Sales report, which measures the seasonally adjusted sale of retail goods and services, showed a month over month increase in consumer spending of 1.3% compared to the consensus estimate of 1.0%. After adjusting for inflation using components of the Consumer Price Index, real retail sales grew by 0.8%.
The consumer continues to prove their ability to spend amid 40-year high inflation. Earnings growth is not keeping pace with price increases, so the consumer’s resilient spending power must be fueled by other sources. One potential source is pent up cash from the pandemic. In their earnings reports, banks have shown that even the least affluent consumers still have a surplus of cash in their deposit accounts after receiving government stimulus and having a limited ability to spend during lockdowns.3 Consumers are also able to spend more by saving less, the personal savings rate is currently 3.3%, its lowest level since 2007 and well below the long-term average of 8.8%. Lastly, people are taking on more debt. The Federal Reserve of New York shows U.S. credit card debt increasing 15% year over year in the third quarter. This is the largest increase year over year in the data available, going back to 2003. Total consumer debt, which also includes items like mortgages, auto loans, and student loans, increased by 8% year over year in the third quarter, its fastest pace since 2008.4
These sources of spending are not necessarily sustainable. Eventually, inflation will need to fall, or people will need to adjust their spending habits.
Global Inflation
Several major counties reported inflation last week. The United Kingdom reported 11.1% year over year inflation while the Eurozone reported 10.6% and Germany reported 10.4%, all new cycle highs. Japan and France also reported new cycle highs last week, while Canada’s annual inflation fell slightly. While the U.S. is showing promising signs that price pressures are abating, the global inflation crisis is most certainly still in full swing.
Equities
Equity markets had a relatively quiet week with the S&P 500 falling just 0.62%. The S&P 500 is now 16.1% off its all-time high set on January 3, 2022. While the index has gained 10.9% in the fourth quarter so far, the S&P 500 has not posted a positive quarter since the fourth quarter of 2021.
Earnings season is nearly over with 94% of S&P 500 companies reporting third quarter results. The blended earnings growth rate remains at 2.2%, the lowest since the third quarter of 2020. The Energy sector has easily seen the most growth of any sector, with its earnings growing an astounding 137% year over year. If the Energy sector was excluded from the S&P 500, the earnings growth for the index would be negative 5.3% in third quarter.5
Target and Walmart both posted very different earnings results last week. Target missed earnings targets by nearly 30% and projected a drop in comparable sales for the first time in five years.6 Walmart, on the other hand, posted better earnings than expected and was able to sell a significant portion of its excess inventory.7 A potential conclusion for this discrepancy is consumers are switching to lower cost alternatives amid higher inflation.
Fixed Income
The two-year Treasury rate gained about 10bps last week, closing at 4.5%, while the ten-year rate lost a modest 5bps, ending the week at around 3.4%. The U.S. Aggregate Bond index is down 13.4% year to date and is 15.3% off its all-time high set in August 2020.
Markets still favor a 50bps interest rate hike in December, which would bring the upper limit of the target federal funds rate to 4.5%. It seems that throughout the year, Fed officials have mostly been on the same page: calling for extremely restrictive monetary policy to stop inflation from getting out of hand. We are now seeing some Fed officials express a wider variety of opinions on the outlook of future interest rate hikes. Some say there is a ways to go before hikes are done, while others have stated there may justification to start moving at a slower pace. In the December visit, the Fed will release their economic projections and we will be able to determine what the consensus estimates are for rates hikes in the coming years.
What to Watch for This Week
- Durable Goods Orders will be released on Wednesday, the consensus estimate is for a monthly increase of 0.4%, equal to the increase in September
Interesting Articles
- Josh Zumbrun: Inflation and Unemployment Both Make You Miserable, but Maybe Not Equally
- Charlie Bilello: A Bear Market Checklist
References
- Bureau of Labor Statistics: Producer Price Index
- U.S. Census Bureau: Advance Monthly Sales For Retail And Food Services: October 2022
- Bank of America 3Q22 Financial Results
- Federal Reserve Bank of New York: Household Debt and Credit Report Q3 2022
- FactSet: Earnings Insight
- Bloomberg: Target Cuts Outlook, Misses Big on Profit as Its Shoppers Retrench
- Walmart Financial Presentation Q3 FY 2023
All data and figures in this article were collected from YCharts, Inc. on 11/21/2022 by Colin Bohne of Blue Ridge Wealth Planners unless otherwise cited.
This material represents an assessment of the market and economic environment at a specific point in time and is not intended to be a forecast of future events, or a guarantee of future results. Forward-looking statements are subject to certain risks and uncertainties. Actual results, performance, or achievements may differ materially from those expressed or implied. Information is based on data gathered from what we believe are reliable sources. It is not guaranteed as to accuracy, does not purport to be complete and is not intended to be used as a primary basis for investment decisions. It should also not be construed as advice visit the particular investment needs of any investor. Past performance does not guarantee future results.
Investments in emerging markets may be more volatile and less liquid than investing in developed markets and may involve exposure to economic structures that are generally less diverse and mature and to political systems which have less stability than those of more developed countries
The performance figures shown are gross of investment advisory fees and other expenses. The deduction of these management fees and expenses would reduce the overall return. Because fees are deducted quarterly, the compounding effect would be to increase the impact of the fee deduction on gross account performance by a greater percentage than that of the annual fee charged. For example, if an account is charged a 1% management fee per year and has gross performance of 12% during that same period, the compounding effect of the quarterly fee assessments will result in an actual return of approximately 10.9%.
Investments in commodities may have greater volatility than investments in traditional securities, particularly if the instruments involve leverage. The value of commodity-linked derivative instruments may be affected by changes in overall market movements, commodity index volatility, changes in interest rates or factors affecting a particular industry or commodity, such as drought, floods, weather, livestock disease, embargoes, tariffs and international economic, political and regulatory developments. Use of leveraged commodity-linked derivatives creates an opportunity for increased return but, at the same time, creates the possibility for greater loss.
Indices are unmanaged and investors cannot invest directly in an index. Unless otherwise noted, performance of indices does not account for any fees, commissions or other expenses that would be incurred. Returns do not include reinvested dividends.
The Standard & Poor's 500 (S&P 500) is an unmanaged group of securities considered to be representative of the stock market in general. It is a market value weighted index with each stock's weight in the index proportionate to its market value.
The Financial Times Stock Exchange 100 Index, also called the FTSE 100 Index, FTSE 100, FTSE, or, informally, the "Footsie" is a share index of the 100 companies listed on the London Stock Exchange with the highest market capitalization. It is seen as a gauge of prosperity for businesses regulated by UK company law.
The FTSE Developed Europe Index is an index of European stocks, part of the FTSE Global Equity Index Series. It is a subset of the FTSE Europe Index. The FTSE Eurobloc Index is a subset of it.
The MSCI Emerging Markets Index is a float-adjusted market capitalization index that consists of indices in 21 emerging economies: Brazil, Chile, China, Colombia, Czech Republic, Egypt, Hungary, India, Indonesia, Korea, Malaysia, Mexico, Morocco, Peru, Philippines, Poland, Russia, South Africa, Taiwan, Thailand, and Turkey.
The Bloomberg Barclays US Aggregate Bond Index, or the Agg, is a broad base, market capitalization-weighted bond market index representing intermediate term investment grade bonds traded in the United States. Investors frequently use the index as a stand-in for measuring the performance of the US bond market.
The US Dollar Index (USDX, DXY) is an index (or measure) of the value of the United States dollar relative to a basket of foreign currencies, often referred to as a basket of US trade partners' currencies.
The Producer Price Index (PPI) is a family of indexes that measures the average change in selling prices received by domestic producers of goods and services over time. PPIs measure price change from the perspective of the seller.
The Consumer Price Index (CPI) is a measure of inflation compiled by the US Bureau of Labor Studies.
Market Update: November 7 - 11, 2022

Economic Data Last Week
Consumer Price Index (CPI)1
The CPI report showed inflation decelerating much more than expectations last month. The headline CPI number showed year over year growth in aggregate prices of 7.7% compared to the consensus estimate of 8%. Year over year inflation has not been below 8% since February of this year. This is the first time CPI has come in slower than consensus estimates since August and it’s the first time CPI has been reported below even the lowest economist estimate since 2020. Perhaps more importantly, after stripping out the volatile food and energy prices, Core CPI was reported at 6.3% compared to the consensus forecast of 6.5%. Month over month figures for both CPI and Core CPI were also reported below forecasts.
Looking at other measurements of CPI also show promising signs that inflation has peaked and is moving encouragingly in the right direction. The Cleveland Fed’s “Trimmed Mean CPI”, which strips out the most extreme values of inflation, fell for the first time since January of 2021.2 The consistent rise in this measure has previously indicated that rising prices were a problem in several segments of the economy rather than a select few.
Another measure of inflation getting a lot of attention is the Atlanta Fed’s Sticky Price Inflation Index.3 In this index, the Atlanta Fed separates CPI into two categories: Flexible CPI, which includes items that can have their prices easily updated immediately, like gasoline, and Sticky CPI, which includes items with prices that are much more difficult and slower to update, like rent. The theory is that sticky prices are very slow to reflect economic conditions, but they better reflect long term expectations of inflation. If it is costly and slow to change prices, businesses will want their price decisions to account for inflation over longer time periods, so a rising Sticky Price CPI index can illustrate that inflationary pressure is gaining strength. The growth in Sticky Price CPI was reported at 6.5% year over year in October, equal to the 6.5% year over year growth reported in September. This is the first time the year over year change hasn’t increased from month to month since July 2021.
An additional development in inflation this week was the University of Michigan’s consumer sentiment index.4 Part of this index tracks where consumers think inflation will be in the future. Fed chairman, Jerome Powell, has illustrated the importance of getting consumer expectations of inflation down and has cited the results from the University of Michigan index specifically. Unfortunately, inflation expectations for both one and five years ahead increased slightly this month.
Equities
Equity markets rallied last week with the S&P 500 gaining 5.9%. The overwhelming majority of these gains were realized after the CPI report showed unexpectedly positive inflation data. On Thursday following the report, the S&P 500 gained 5.5% and the Nasdaq 100 gained 7.5%. This is the biggest one-day gain for either index since the extreme volatility during the 2020 drawdown. This is only the fifth time in the last 20 years the Nasdaq 100 has gained 7.5% or more in a single day.
Fixed Income
A lower-than-expected CPI report sets off a chain of events in financial markets. If inflation is decelerating significantly, the Fed may not have to hike rates as much as previously expected. This brought U.S. Treasury rates down across the curve. On Thursday, the ten-year rate fell 33bps while the 2-year rate fell 30bps. Markets now favor a 50bps hike in December after four 75bps rate hikes in a row.5
Lower interest rates in the U.S. makes investing in Treasuries less enticing to investors abroad; thus, decreasing the value of the U.S. dollar relative to other major currencies. The U.S. Dollar Index fell 2% on Thursday and one Euro can now buy 1.03 dollars, the highest amount since August. A strong dollar has an adverse effect on companies with a large portion of their revenues coming from abroad. Half of S&P 500 companies have cited a strong dollar as having a negative impact on earnings in the third quarter, with earning growth for companies with a majority of their earnings coming from within the U.S. far outpacing earnings growth for companies that get over half of their revenue from abroad.6 So, slower inflation can lead to lower interest rates, which can lead to a weaker dollar and potentially higher corporate earnings growth.
What to Watch for This Week
- The Producer Price Index will be reported on Tuesday, the consensus estimate is for a 0.4% month over month growth, no change from last month
- U.S. Retail Sales will be released on Wednesday, analysts expect a growth of 1% month over month after being flat last month
- The Euro Area, UK, Canada, France, and Japan all release inflation this week
Interesting Articles
- Jonathan Levin: The Path to a Soft Landing Runs Through Corporate Earnings
- Justin Fox: Americans Have $5 Trillion in Cash, Thanks to Federal Stimulus
References
- Bureau of Labor Statistics: Consumer Price Index Summary
- Federal Reserve Bank of Cleveland: Median CPI
- Federal Reserve Bank of Atlanta: Sticky-Price CPI
- University of Michigan: Survey of Consumers
- CME FedWatch Tool
- Fact Set: Earnings Insight
All data and figures in this article were collected from YCharts, Inc. on 11/14//2022 by Colin Bohne of Blue Ridge Wealth Planners unless otherwise cited.
This material represents an assessment of the market and economic environment at a specific point in time and is not intended to be a forecast of future events, or a guarantee of future results. Forward-looking statements are subject to certain risks and uncertainties. Actual results, performance, or achievements may differ materially from those expressed or implied. Information is based on data gathered from what we believe are reliable sources. It is not guaranteed as to accuracy, does not purport to be complete and is not intended to be used as a primary basis for investment decisions. It should also not be construed as advice visit the particular investment needs of any investor. Past performance does not guarantee future results.
Investments in emerging markets may be more volatile and less liquid than investing in developed markets and may involve exposure to economic structures that are generally less diverse and mature and to political systems which have less stability than those of more developed countries.
The performance figures shown are gross of investment advisory fees and other expenses. The deduction of these management fees and expenses would reduce the overall return. Because fees are deducted quarterly, the compounding effect would be to increase the impact of the fee deduction on gross account performance by a greater percentage than that of the annual fee charged. For example, if an account is charged a 1% management fee per year and has gross performance of 12% during that same period, the compounding effect of the quarterly fee assessments will result in an actual return of approximately 10.9%.
Investments in commodities may have greater volatility than investments in traditional securities, particularly if the instruments involve leverage. The value of commodity-linked derivative instruments may be affected by changes in overall market movements, commodity index volatility, changes in interest rates or factors affecting a particular industry or commodity, such as drought, floods, weather, livestock disease, embargoes, tariffs and international economic, political and regulatory developments. Use of leveraged commodity-linked derivatives creates an opportunity for increased return but, at the same time, creates the possibility for greater loss.
Indices are unmanaged and investors cannot invest directly in an index. Unless otherwise noted, performance of indices does not account for any fees, commissions or other expenses that would be incurred. Returns do not include reinvested dividends.
The Standard & Poor's 500 (S&P 500) is an unmanaged group of securities considered to be representative of the stock market in general. It is a market value weighted index with each stock's weight in the index proportionate to its market value.
The Financial Times Stock Exchange 100 Index, also called the FTSE 100 Index, FTSE 100, FTSE, or, informally, the "Footsie" is a share index of the 100 companies listed on the London Stock Exchange with the highest market capitalization. It is seen as a gauge of prosperity for businesses regulated by UK company law.
The FTSE Developed Europe Index is an index of European stocks, part of the FTSE Global Equity Index Series. It is a subset of the FTSE Europe Index. The FTSE Eurobloc Index is a subset of it.
The MSCI Emerging Markets Index is a float-adjusted market capitalization index that consists of indices in 21 emerging economies: Brazil, Chile, China, Colombia, Czech Republic, Egypt, Hungary, India, Indonesia, Korea, Malaysia, Mexico, Morocco, Peru, Philippines, Poland, Russia, South Africa, Taiwan, Thailand, and Turkey.
The Bloomberg Barclays US Aggregate Bond Index, or the Agg, is a broad base, market capitalization-weighted bond market index representing intermediate term investment grade bonds traded in the United States. Investors frequently use the index as a stand-in for measuring the performance of the US bond market.
The US Dollar Index (USDX, DXY) is an index (or measure) of the value of the United States dollar relative to a basket of foreign currencies, often referred to as a basket of US trade partners' currencies.
The U of M Consumer Sentiment Index is a survey of consumer confidence conducted by the University of Michigan and Thompson Reuters. The Michigan Consumer Sentiment Index (MCSI) uses telephone surveys to gather information on consumer expectations regarding the overall economy.
The Producer Price Index (PPI) is a family of indexes that measures the average change in selling prices received by domestic producers of goods and services over time. PPIs measure price change from the perspective of the seller.
The Consumer Price Index (CPI) is a measure of inflation compiled by the US Bureau of Labor Studies.
The Nasdaq 100 is an index composed of the 100 largest, most actively traded U.S companies listed on the Nasdaq stock exchange. This index includes companies from a broad range of industries with the exception of those that operate in the financial industry, such as banks and investment companies.
Market Update: October 31 - November 4, 2022

Economic Data Last Week
Payroll Report1
The Bureau of Labor Statistics released their employment situation report on Friday, detailing the changes in the labor market in October. Overall, the payroll report showed continued strength in the labor market with 261,000 new jobs added to the economy last month, compared with the consensus estimate of 200,000. However, the unemployment rate actually rose to 3.7% from 3.5%, while the participation rate declined slightly. The unemployment and participation rate are derived from a separate survey that is conducted on households rather than on businesses and can occasionally show discrepancies from the headline number that we get from the payroll report. According to the household survey, the increase in the unemployment rate was a result of an addition of 306,000 unemployed workers in October. The last time the unemployment rate increased was this past August, but it was a result of more people entering the labor force. When you are not actively looking for a job, you are not considered unemployed. So, an uptick in the unemployment rate can be a result of more job seekers in the economy rather than of layoffs or a slowdown in hiring. That isn’t necessarily the case in the report this month because the participation rate decreased while the unemployment rate increased. So, the October household survey shows more people unemployed and less people participating in the labor force. The discrepancies in the surveys make it difficult to draw conclusions from the data, one shows continued growth in the labor market while the other shows signs of weakness.
Information was also released this week showing job openings increasing in September. As of now there are 1.9 available jobs for every one person seeking employment.2 Fed chairman, Jerome Powell, has mentioned this ratio several times this year; he believes we need to see the amount of people looking for work and the number of open positions come into balance in order to slow wage growth and ultimately bring down inflation. The jobs report showed wages growing 0.4% in October, faster than analysts’ expectation of 0.3%. Year over year wages grew 4.7% in October, which is slower than the 5% growth recorded in the previous month, but still much faster than the long-term average of 2.9%. In the Fed’s ideal scenario, what they have been referring to as a soft landing, the number of job openings would come down without a significant increase in layoffs. Moreover, more people would enter the labor force, pushing the participation rate up. This would bring the supply and demand for workers into balance, potentially slowing wage growth and inflation with minimal pain on households.
Equities
The S&P 500 ended the week down 3.3%, with the majority of its losses coming after the Federal Reserve’s interest rate hike announcement on Wednesday. The S&P 500 is up 5.4% in the fourth quarter and remains 20.3% off its all-time high set on January 3, 2022.
A majority of the companies in the S&P 500 have reported earnings results for the third quarter. The projected earnings growth rate is 2.2%.3 If 2.2% ends up being the actual earnings growth for the quarter, it will be the lowest earnings growth rate since the third quarter of 2020 where earnings fell 5.7%.
Retailers tend to add employees to their workforce in anticipation of the surge in sales due to the holidays. The holiday hiring season typically starts in October and is most prominent in November. The number of workers retailers hire can give us some insight on how much retail sales will grow in the winter. If companies are hiring much more worker than usual, they likely expect the holiday season to be much busier than usual. This October, retailers added 163,000 jobs, roughly 30% less than they added in the month of October in the previous two years.1 This is consistent with Amazon’s earnings report released earlier this month forecasting lackluster growth in sales this winter.4
Fixed Income
The two-year Treasury rate found new cycle highs last week, closing the week at 4.7%, its highest level since 2007. The U.S. Aggregate bond index is 17.6% off its all-time high set in August 2020.
The Federal Reserve announced a 75bps rate hike on Wednesday, which was in line with expectations. The upper limit of the target federal funds rate is now 4%. This is the fourth hike of 75bps in a row and the target federal funds rate is now at its highest level since 2007. Investors continue to look for clues that indicate when the Federal Reserve will slow their pace of rate increases and eventually stop hiking all together. On Wednesday, the Fed acknowledged that the rate hikes they have done so far will work on a lag, and that we haven’t seen the full impact that they will have on the economy just yet. Jerome Powell was also very clear that it is too soon to start thinking about pausing rate increases and that the Fed needs to continue to restrict economic growth to stop inflation. Stocks and bonds both fell following the visit.
The next FOMC visit is in December, where investors are placing nearly even probabilities that we will see either a 50 or 75bps rate hike. The Fed’s current economic projections, last updated in September, indicate that the federal funds rate will get as high as 4.6% in 2023. They will release new projections in December, and based on Jerome Powell’s comments, their estimated federal funds rate for 2023 will most likely be revised higher.
What to Watch for This Week
- CPI will be reported on Thursday. The consensus estimate is for a year over year increase of 8% after increasing 8.2% in the previous month. Core CPI is expected to slow slightly to 6.5% after being reported at 6.6% last month.
Interesting Articles
- Sam Ro: Why stocks rally when everything else is getting worse
- Ben Carlson: Why Today’s Inflation is Not a Repeat of the 1970s
References
- Bureau of Labor Statistics: Employment Situation – October 2022
- Bureau of Labor Statistics: Job Openings and Labor Turnover Summary
- Fact Set Earnings Insight
- Wall Street Journal: Amazon’s Holiday Blues Come Early – and Hard
All data and figures in this article were collected from YCharts, Inc. on 11/07//2022 by Colin Bohne of Blue Ridge Wealth Planners unless otherwise cited.
This material represents an assessment of the market and economic environment at a specific point in time and is not intended to be a forecast of future events, or a guarantee of future results. Forward-looking statements are subject to certain risks and uncertainties. Actual results, performance, or achievements may differ materially from those expressed or implied. Information is based on data gathered from what we believe are reliable sources. It is not guaranteed as to accuracy, does not purport to be complete and is not intended to be used as a primary basis for investment decisions. It should also not be construed as advice visit the particular investment needs of any investor. Past performance does not guarantee future results.
Investments in emerging markets may be more volatile and less liquid than investing in developed markets and may involve exposure to economic structures that are generally less diverse and mature and to political systems which have less stability than those of more developed countries.
The performance figures shown are gross of investment advisory fees and other expenses. The deduction of these management fees and expenses would reduce the overall return. Because fees are deducted quarterly, the compounding effect would be to increase the impact of the fee deduction on gross account performance by a greater percentage than that of the annual fee charged. For example, if an account is charged a 1% management fee per year and has gross performance of 12% during that same period, the compounding effect of the quarterly fee assessments will result in an actual return of approximately 10.9%.
Investments in commodities may have greater volatility than investments in traditional securities, particularly if the instruments involve leverage. The value of commodity-linked derivative instruments may be affected by changes in overall market movements, commodity index volatility, changes in interest rates or factors affecting a particular industry or commodity, such as drought, floods, weather, livestock disease, embargoes, tariffs and international economic, political and regulatory developments. Use of leveraged commodity-linked derivatives creates an opportunity for increased return but, at the same time, creates the possibility for greater loss.
Indices are unmanaged and investors cannot invest directly in an index. Unless otherwise noted, performance of indices does not account for any fees, commissions or other expenses that would be incurred. Returns do not include reinvested dividends.
The Standard & Poor's 500 (S&P 500) is an unmanaged group of securities considered to be representative of the stock market in general. It is a market value weighted index with each stock's weight in the index proportionate to its market value.
The Financial Times Stock Exchange 100 Index, also called the FTSE 100 Index, FTSE 100, FTSE, or, informally, the "Footsie" is a share index of the 100 companies listed on the London Stock Exchange with the highest market capitalization. It is seen as a gauge of prosperity for businesses regulated by UK company law.
The FTSE Developed Europe Index is an index of European stocks, part of the FTSE Global Equity Index Series. It is a subset of the FTSE Europe Index. The FTSE Eurobloc Index is a subset of it.
The MSCI Emerging Markets Index is a float-adjusted market capitalization index that consists of indices in 21 emerging economies: Brazil, Chile, China, Colombia, Czech Republic, Egypt, Hungary, India, Indonesia, Korea, Malaysia, Mexico, Morocco, Peru, Philippines, Poland, Russia, South Africa, Taiwan, Thailand, and Turkey.
The Bloomberg Barclays US Aggregate Bond Index, or the Agg, is a broad base, market capitalization-weighted bond market index representing intermediate term investment grade bonds traded in the United States. Investors frequently use the index as a stand-in for measuring the performance of the US bond market.
The US Dollar Index (USDX, DXY) is an index (or measure) of the value of the United States dollar relative to a basket of foreign currencies, often referred to as a basket of US trade partners' currencies.
Market Update: October 24 - 28, 2022

Economic Data Last Week
Real Gross Domestic Product (GDP)1
Real U.S. GDP measures the inflation adjusted value of goods produced and services provided within the United States over a given period of time. Real GDP increased at an annualized rate of 2.6% in the third quarter, more than the consensus estimate of 2.4%, but less than the long-term average of 3.2%. Positive third quarter growth in GDP represents a growing U.S. economy despite negative GDP prints in the first two quarters of the year.
Personal Consumption Expenditures Price Index (PCE)2
The PCE Price Index is the Federal Reserve’s preferred measure of inflation. The PCE price index is similar to CPI in the sense that it attempts to track the changes in aggregate price levels; however, the PCE index includes a more comprehensive list of consumer expenditures. Additionally, the PCE price index takes changes in consumer preferences into account, like altering one’s purchasing habits when certain products become more expensive than others. The PCE price index grew 6.2% year over year in September, the slowest pace since January 2022, but still much faster than the Fed’s 2% target. Perhaps more worrisome is the core PCE price index, which strips out volatile items such as food and energy. In September, Core PCE grew 5.1% year over year, its fastest pace since March of this year. This is similar to what we are seeing in CPI where price increases at the beginning of the year were mostly due to very high energy inflation, but price increases are now becoming broad based with a multitude of categories experiencing faster price appreciation. The Federal Reserve Bank of Dallas measures this phenomenon with the “Trimmed Mean PCE Inflation Rate”, which removes the items with the most extreme inflation and calculates aggregate price growth using the remaining categories.3 The Trimmed Mean PCE was at 3.3% to start the year, its most recent reading was 4.7%, signaling that the inflation we are experiencing today cannot be completely attributed to the very volatile prices of a select few items.
Global Ocean Shipping Rates
When the global economy was shut down and reopened, many industries struggled to recover. One of the hardest hit was the container shipping industry, causing delivery times and costs to increase dramatically. For this reason, shipping rates and delivery times have been a closely watched metric to measure the extent of lingering supply chain disruptions caused by the pandemic. The Freightos Baltic Index, which measures the cost to ship a 40-foot container overseas, fell to $3,340 last week, its lowest level since 2020.4 Additionally, the amount of time it takes to ship and unload a cargo ready container from China to the United States is near its lowest number of days since the first quarter of 2021.5
Equities
Equities ended the week with strong returns, with the S&P 500 gaining nearly 4%. The S&P 500 is up nearly 9% in the third quarter after posting negative returns in the first and second quarters of the year. The index is now 17.6% off its all-time high set on January 3, 2022 and is 9.1% higher than its year-to-date low set on October 12.
Earlier this month, many financial institutions reported better than expected third quarter earnings growth. Big Tech was unfortunately unable to replicate this last week with many of the largest companies in the world reporting lackluster third quarter results and providing poor forecasts that didn’t live up to investors’ expectations. Amazon estimated weak holiday sales this year and Alphabet (Google’s parent company) and Meta (formerly known as Facebook), reported lackluster growth in advertising revenue as businesses cut their marketing expenses amid economic uncertainty. Meta fell 24% last week while Amazon lost 13%, and Alphabet lost 5%. The Nasdaq 100 index, which is heavily overweight technology stocks, is 29.9% off its all-time high set in December of last year.
Fixed Income
Last week, Treasury rates remained relatively unchanged in the short end of the curve with the 2-year Treasury rate closing the week at 4.4%, down just 6bps. However, the 10-year rate fell 21bps and closed the week at 4%. The U.S. Aggregate Bond index is 17% off its all-time high set in August 2020. The index is approaching 27 months since its last all-time high, the longest period ever recorded since the inception of the index in 1976.
Part of the reason financial institutions have posted such strong earnings growth this quarter is the high spread between the amount they charge for loans and the amount they pay for deposits. JP Morgan recently posted its highest quarterly net interest income ever6; this is the money the bank earns on loans minus what the bank pays out for deposits. The average 30-year mortgage now costs customers over 7%, while the average FDIC insured saving account pays only 0.21% in interest.7 The average 60-month CD is not much better, paying an underwhelming 0.83%.7 With the Federal Reserve aggressively hiking rates, it is likely that the interest rate received for parking your money at a bank will start to increase. There is also growing competition among banks that should put upward pressure on deposit rates. While the average savings and CD rates are very low, some banks offer rates as high as 3.5% for savings accounts and 4.25% for five-year CDs.8
What to Watch for This Week
- The Federal Reserve meets on Wednesday, they are expected to hike interest rates by 75bps, bringing the upper limit of the target federal funds rate to 4%.
- Jobs numbers will be reported on Friday, the consensus is for 220,000 jobs to be added to the economy in October, while the unemployment rate ticks up slightly to 3.6%.
- The Bank of England is expected to raise interest rates 75bps to 3%.
Interesting Articles
- Emily Badger and Eve Washington: Why the Price of Gas Has Such Power Over Us
- Bill Dudley: Will Jerome Powell Be Like Volcker or Burns?
References
- U.S. Bureau of Economic Analysis: Gross Domestic Product, Third Quarter 2022 (Advance Estimate)
- U.S. Bureau of Economic Analysis: Personal Income and Outlays, September 2022
- Federal Reserve Bank of Dallas: Trimmed Mean PCE Inflation Rate
- Freightos Baltic Index (FBX): Global Container Freight Index
- Flexport: Ocean Timeliness Indicator
- JP Morgan Chase: 3Q22 Financial Results
- FDIC: National Rates and Rate Caps
- Bankrate
All data and figures in this article were collected from YCharts, Inc. on 10/31/2022 by Colin Bohne of Blue Ridge Wealth Planners unless otherwise cited.
This material represents an assessment of the market and economic environment at a specific point in time and is not intended to be a forecast of future events, or a guarantee of future results. Forward-looking statements are subject to certain risks and uncertainties. Actual results, performance, or achievements may differ materially from those expressed or implied. Information is based on data gathered from what we believe are reliable sources. It is not guaranteed as to accuracy, does not purport to be complete and is not intended to be used as a primary basis for investment decisions. It should also not be construed as advice visit the particular investment needs of any investor. Past performance does not guarantee future results.
Investments in emerging markets may be more volatile and less liquid than investing in developed markets and may involve exposure to economic structures that are generally less diverse and mature and to political systems which have less stability than those of more developed countries
The performance figures shown are gross of investment advisory fees and other expenses. The deduction of these management fees and expenses would reduce the overall return. Because fees are deducted quarterly, the compounding effect would be to increase the impact of the fee deduction on gross account performance by a greater percentage than that of the annual fee charged. For example, if an account is charged a 1% management fee per year and has gross performance of 12% during that same period, the compounding effect of the quarterly fee assessments will result in an actual return of approximately 10.9%.
Investments in commodities may have greater volatility than investments in traditional securities, particularly if the instruments involve leverage. The value of commodity-linked derivative instruments may be affected by changes in overall market movements, commodity index volatility, changes in interest rates or factors affecting a particular industry or commodity, such as drought, floods, weather, livestock disease, embargoes, tariffs and international economic, political and regulatory developments. Use of leveraged commodity-linked derivatives creates an opportunity for increased return but, at the same time, creates the possibility for greater loss.
Indices are unmanaged and investors cannot invest directly in an index. Unless otherwise noted, performance of indices does not account for any fees, commissions or other expenses that would be incurred. Returns do not include reinvested dividends.
The Standard & Poor's 500 (S&P 500) is an unmanaged group of securities considered to be representative of the stock market in general. It is a market value weighted index with each stock's weight in the index proportionate to its market value.
The Financial Times Stock Exchange 100 Index, also called the FTSE 100 Index, FTSE 100, FTSE, or, informally, the "Footsie" is a share index of the 100 companies listed on the London Stock Exchange with the highest market capitalization. It is seen as a gauge of prosperity for businesses regulated by UK company law.
The FTSE Developed Europe Index is an index of European stocks, part of the FTSE Global Equity Index Series. It is a subset of the FTSE Europe Index. The FTSE Eurobloc Index is a subset of it.
The MSCI Emerging Markets Index is a float-adjusted market capitalization index that consists of indices in 21 emerging economies: Brazil, Chile, China, Colombia, Czech Republic, Egypt, Hungary, India, Indonesia, Korea, Malaysia, Mexico, Morocco, Peru, Philippines, Poland, Russia, South Africa, Taiwan, Thailand, and Turkey.
The Bloomberg Barclays US Aggregate Bond Index, or the Agg, is a broad base, market capitalization-weighted bond market index representing intermediate term investment grade bonds traded in the United States. Investors frequently use the index as a stand-in for measuring the performance of the US bond market.
The US Dollar Index (USDX, DXY) is an index (or measure) of the value of the United States dollar relative to a basket of foreign currencies, often referred to as a basket of US trade partners' currencies.
The Consumer Price Index (CPI) is a measure of inflation compiled by the US Bureau of Labor Studies.
The PCE price index (PCEPI), also referred to as the PCE deflator, PCE price deflator, or the Implicit Price Deflator for Personal Consumption Expenditures (IPD for PCE) by the BEA, and as the Chain-type Price Index for Personal Consumption Expenditures (CTPIPCE) by the Federal Open Market Committee (FOMC), is a United States-wide indicator of the average increase in prices for all domestic personal consumption. It is benchmarked to a base of 2012 = 100. Using a variety of data including U.S. Consumer Price Index and Producer Price Index prices, it is derived from the largest component of the GDP in the BEA's National Income and Product Accounts, personal consumption expenditures.
Market Update: October 17 - 21, 2022

Economic Data Last Week
US CPI Report1
The inflation data from the CPI report on October 13th showed aggregate prices increasing more than expected. The year over year inflation rate is now 8.2%, higher than the consensus estimate of 8.1%, but lower than last month’s reading of 8.3%. Year over year inflation has steadily decreased since its current cycle high of 9.1% set in June of this year, yet aggregate prices remain stubbornly high. Investors and consumers have expected price growth to slow much faster than it has amid the Federal Reserve’s aggressive monetary policy.
Energy prices fell month over month for the third month in a row, falling 2.1% in September, led by gasoline prices which fell nearly 5%. Year over year growth in energy prices remains very high with oil prices around 58% higher today than this time last year. Keep in mind that year over year oil prices are comparing the cost of oil today with the cost of oil from September 2021, when Crude Oil was trading at a mere $70 a barrel. As time goes on, the year over year comparison will become more favorable and annual energy inflation should come down even if oil prices remain flat. The price of Crude Oil in March 2022 was between $100 and $120 a barrel. So if the price of oil remains around $80-$90 like it has the past three months, annual energy inflation in March 2023 can be negative without prices necessarily needing to fall from here.
Several countries reported inflation last week: The United Kingdom matched their current cycle high at 10.1%. Canada and France both showed signs of price growth slowing, reporting 6.9% and 5.6% respectively. The Euro Area set a new cycle high at 9.9%.
University of Michigan Consumer Sentiment2
The University of Michigan Consumer Sentiment Index is a monthly survey used to gauge consumer confidence levels in the United States. Questions are asked about consumers’ views of their current financial situation as well as their outlook on the economy and inflation. In June of this year, around the same time gasoline prices reached all-time highs, the index reached an all-time low with a reading of 50, meaning consumers were reportedly more pessimistic than they have been in the history of the survey. As gas prices fell, consumers felt better about their current and future economic situation and the index improved, increasing to a value of 60 last week, slightly higher than the lows reached during the Great Financial Crisis in 2008. A key component of the index is consumer expectations of inflation. The Federal Reserve has cited inflation expectations in this report when raising interest rates, claiming getting expectations under control was crucial to avoid inflation getting out of hand. The October report showed household one year inflation expectations increasing for the first time since March of this year.
Equities
After several very volatile weeks in a row, the S&P 500 had a relatively calm week last week, gaining 2%. The index is 20.7% off its all-time high set at the beginning of the year and it is 5% higher than its year-to-date low set on October 12, 2022.
Earnings season is underway with many major banks reporting third quarter results last week. Investors are closely watching third quarter earnings for signs that interest rate hikes are finally starting to slow the economy and many of the reports so far have failed to show that. The Bank of America earnings call showed that consumers are still spending, with credit card usage increasing 13% year over year in the third quarter. The report also showed that despite the low personal savings rate, consumers still have pent up savings from the pandemic, with the least affluent Bank of America customers having five times the amount of cash in their accounts than they had in January 2020. Finally, the report showed credit card delinquencies at their second lowest level in the history of the bank with only 1.4% of credit card balances over 30 days past due.
With strong consumer spending, healthy balance sheets, and low unemployment, it’s difficult to make an argument that the U.S. economy is slowing down significantly. However, only 20% of S&P 500 companies have reported third quarter earnings, the remaining earnings reports will offer some much-needed guidance on the state of the economy.
Fixed Income
Interest rates continued their ascent with the 10-year Treasury rate closing over 4.2%, gaining 20bps last week. The 10-year rate has now increased for 12 weeks in a row, the longest streak since 1984.4 The three-month Treasury rate crossed over 4% last week, after closing at just 0.06% a year ago. The three-month rate briefly traded higher than the 10-year rate last week, another popular indicator that typically precedes a recession.
What to Watch for This Week
- The first estimate of third quarter GDP will be released on Thursday, the consensus estimate is for a growth rate of 2.4%. This would be a large improvement from the first and second quarters in which GDP contracted.
- Durable Goods Orders are expected to grow by 0.6% after falling 0.2% last month.
- The European Central Bank and the Bank of Canada both meet this week, both are expected to raise interest rates by 75bps.
Interesting Articles
- Ben Carlson: Why Isn’t Inflation Falling?
- Truman Du: Animation: The Largest Public Companies by Market Cap (2000-2022)
References
- U.S. Bureau of Labor Statistics: Consumer Price Index Summary
- University of Michigan: Survey of Consumers
- Bank of America 3Q22 Financial Results
- Bloomberg: Global Bond Yields Reach Key Milestones as Rate-Hike Bets Mount
All data and figures in this article were collected from YCharts, Inc. on 10/24/2022 by Colin Bohne of Blue Ridge Wealth Planners unless otherwise cited.
This material represents an assessment of the market and economic environment at a specific point in time and is not intended to be a forecast of future events, or a guarantee of future results. Forward-looking statements are subject to certain risks and uncertainties. Actual results, performance, or achievements may differ materially from those expressed or implied. Information is based on data gathered from what we believe are reliable sources. It is not guaranteed as to accuracy, does not purport to be complete and is not intended to be used as a primary basis for investment decisions. It should also not be construed as advice visit the particular investment needs of any investor. Past performance does not guarantee future results.
Investments in emerging markets may be more volatile and less liquid than investing in developed markets and may involve exposure to economic structures that are generally less diverse and mature and to political systems which have less stability than those of more developed countries
The performance figures shown are gross of investment advisory fees and other expenses. The deduction of these management fees and expenses would reduce the overall return. Because fees are deducted quarterly, the compounding effect would be to increase the impact of the fee deduction on gross account performance by a greater percentage than that of the annual fee charged. For example, if an account is charged a 1% management fee per year and has gross performance of 12% during that same period, the compounding effect of the quarterly fee assessments will result in an actual return of approximately 10.9%.
Investments in commodities may have greater volatility than investments in traditional securities, particularly if the instruments involve leverage. The value of commodity-linked derivative instruments may be affected by changes in overall market movements, commodity index volatility, changes in interest rates or factors affecting a particular industry or commodity, such as drought, floods, weather, livestock disease, embargoes, tariffs and international economic, political and regulatory developments. Use of leveraged commodity-linked derivatives creates an opportunity for increased return but, at the same time, creates the possibility for greater loss.
Indices are unmanaged and investors cannot invest directly in an index. Unless otherwise noted, performance of indices does not account for any fees, commissions or other expenses that would be incurred. Returns do not include reinvested dividends.
The Standard & Poor's 500 (S&P 500) is an unmanaged group of securities considered to be representative of the stock market in general. It is a market value weighted index with each stock's weight in the index proportionate to its market value.
The Financial Times Stock Exchange 100 Index, also called the FTSE 100 Index, FTSE 100, FTSE, or, informally, the "Footsie" is a share index of the 100 companies listed on the London Stock Exchange with the highest market capitalization. It is seen as a gauge of prosperity for businesses regulated by UK company law.
The FTSE Developed Europe Index is an index of European stocks, part of the FTSE Global Equity Index Series. It is a subset of the FTSE Europe Index. The FTSE Eurobloc Index is a subset of it.
The MSCI Emerging Markets Index is a float-adjusted market capitalization index that consists of indices in 21 emerging economies: Brazil, Chile, China, Colombia, Czech Republic, Egypt, Hungary, India, Indonesia, Korea, Malaysia, Mexico, Morocco, Peru, Philippines, Poland, Russia, South Africa, Taiwan, Thailand, and Turkey.
The Bloomberg Barclays US Aggregate Bond Index, or the Agg, is a broad base, market capitalization-weighted bond market index representing intermediate term investment grade bonds traded in the United States. Investors frequently use the index as a stand-in for measuring the performance of the US bond market.
The US Dollar Index (USDX, DXY) is an index (or measure) of the value of the United States dollar relative to a basket of foreign currencies, often referred to as a basket of US trade partners' currencies.
The Consumer Price Index (CPI) is a measure of inflation compiled by the US Bureau of Labor Studies.
The U of M Consumer Sentiment Index is a survey of consumer confidence conducted by the University of Michigan and Thompson Reuters. The Michigan Consumer Sentiment Index (MCSI) uses telephone surveys to gather information on consumer expectations regarding the overall economy.
Market Update: October 3 - 7, 2022
Economic Data Last Week
U.S. Payroll Report1
The Payroll Report showing September employment data came in relatively in line with expectations. There were 263,000 new jobs added to the economy in September compared to the consensus estimate of 250,000. Average hourly earnings grew 5% year over year, below expectations of 5.1%, but much higher than the long-term average of 2.9%. The unemployment rate fell to back to 3.5% after briefly increasing to 3.7% last month. This was mostly as a result of people leaving the labor force as the participation rate fell slightly to 62.3% from 62.4% last month. One is only counted as unemployed if they are actively looking for a job, when people quit looking, they leave the labor force, so the participation rate can fall with the unemployment rate. In another sign that the economy is still healthy, the number of persons employed part time for economic reasons decreased by over 300,000 in September to 3.8 million, the lowest level since 2005.
The inability to find and hire workers has been a major problem this year for many industries. One contributor to this is the change in immigration trends over the past five years. Immigration to the U.S. began to drop in 2017 due to several restrictions enacted by the White House. The flow of immigrants to the U.S was further weakened by travel restrictions implemented during the pandemic. The Kansas City Fed estimates that an additional 3.4 million immigrants would have entered the U.S between 2017 and 2022 without the change in trend that started in 2017.2 Many of these immigrants would have participated in the labor force. Not only has immigration declined, but the average processing time for work visas has slowed from two to four months in 2019 to 11 months in 2021, further weakening the supply of available workers.2 This mostly affects industries where non-U.S. born workers are most prominent, like services, hospitality, and construction. These industries have seen the largest increase in job vacancies and earnings over the past five years. Immigration also benefits industries that do not depend on foreign born workers because immigrants fill jobs that allow others to enter the labor force. Foreign born workers make up 25% of direct care workers, such as home health aides and childcare.2 A shortage of workers in those fields leads to an increase in the cost that can cause some workers to exit the labor force to replace these lost services. Studies have shown that increased immigration leads to substantially lower costs of childcare and increases the number of hours worked by women in the top quartile of the wage distribution. 3,4
Equities
The S&P 500 had a very volatile week, gaining nearly 6% by Tuesday’s close but ending the week up only 1.6% after losing 2.8% on Friday, following the jobs report. There has now been 50 trading days in which the S&P 500 has fallen by 1% or more, the highest number of occurrences since 2009 and there are still three months left in the year. The S&P 500 is currently 23.2% off its all-time high set on January 3, 2022.
Since inflation has been persistent in the markets, good news has been bad news for equities. A strong labor market is good news for the economy and all of the people with jobs but leads to equity price declines. A stronger labor market means higher wages and therefore higher inflation. Higher inflation means more rate hikes from the Federal Reserve, which will likely eventually slow the economy and hurt corporate earnings.
Fixed Income
Like equities, interest rates were very volatile last week, starting the week down and ending up. The 10-year treasury rate fell as low as 3.6% on Tuesday and closed the week at 3.9%. The U.S. Aggregate bond index is 16.6% off its all-time high set in August 2020.
The moderately slower growth in jobs did not offer any relief in the likelihood of an aggressive Federal Reserve as the markets are still favoring a 75bps hike in their November visit, which would be their fourth hike in a row of that magnitude. The inflation report on Thursday will offer some guidance on what the Fed plans to do for the remainder of the year. The Fed will likely need to see price growth slow significantly to avoid increasing the Federal Funds rate to their current estimate of 4.6% to end the year.
Commodities
After just recently closing under $80 a barrel for the first time since January 2022, Crude oil gained 11% this week, closing at $92.64. The likely culprit of the recent surge in oil prices was OPEC+ announcing a cut in their production target by two million barrels a day, the largest cut since the start of the pandemic. A cut in supply without a cut in demand generally leads to an increase in prices. It is historically unusual for OPEC to cut production while the price of oil is already so high, and this announcement signals that OPEC is willing to act to keep oil prices elevated. Further risks to higher oil prices include additional European oil sanctions against Russia, which are set to kick in in December and January, further tightening the supply of oil. The United States is also nearing the end of its planned oil releases from its Strategic Petroleum Reserve. The U.S. has been releasing one million barrels a day from its reserves since April; as of now, there are no scheduled releases after November.
What to Watch for This Week
- CPI will be reported on Thursday. September inflation is expected to be 0.2%, while year over year inflation is expected to be 8.1%, down from 8.3% last month. Core inflation is actually expected to increase to 6.5% year over year, from 6.3% last month.
- PPI will be released on Wednesday: current consensus is for a year over year increase of 8.4%, down from 8.7% last month
- U.S. Retail Sales will be reported on Friday: analysts expect a growth of 0.2% in September
- Germany, France, and China to release inflation this week
Interesting Articles
Ben Carlson: Will the Stock Market Fall if Earnings Fall?
Charlie Bilello: There Will be Drawdowns
References
- Bureau of Labor Statistics: Employment Situation Summary
- Kansas City Fed: Immigration Shortfall May Be a Headwind for Labor Supply
- Delia Furtado: Fertility Responses of High-Skilled Native Woman to Immigrant Inflows
- Patricia Cortés: Low-Skilled Immigration and the Labor Supply of Highly Skilled Woman
All data and figures in this article were collected from YCharts, Inc. on 10/10/2022 by Colin Bohne of Blue Ridge Wealth Planners unless otherwise cited.
This material represents an assessment of the market and economic environment at a specific point in time and is not intended to be a forecast of future events, or a guarantee of future results. Forward-looking statements are subject to certain risks and uncertainties. Actual results, performance, or achievements may differ materially from those expressed or implied. Information is based on data gathered from what we believe are reliable sources. It is not guaranteed as to accuracy, does not purport to be complete and is not intended to be used as a primary basis for investment decisions. It should also not be construed as advice visit the particular investment needs of any investor. Past performance does not guarantee future results.
Investments in emerging markets may be more volatile and less liquid than investing in developed markets and may involve exposure to economic structures that are generally less diverse and mature and to political systems which have less stability than those of more developed countries
The performance figures shown are gross of investment advisory fees and other expenses. The deduction of these management fees and expenses would reduce the overall return. Because fees are deducted quarterly, the compounding effect would be to increase the impact of the fee deduction on gross account performance by a greater percentage than that of the annual fee charged. For example, if an account is charged a 1% management fee per year and has gross performance of 12% during that same period, the compounding effect of the quarterly fee assessments will result in an actual return of approximately 10.9%.
Investments in commodities may have greater volatility than investments in traditional securities, particularly if the instruments involve leverage. The value of commodity-linked derivative instruments may be affected by changes in overall market movements, commodity index volatility, changes in interest rates or factors affecting a particular industry or commodity, such as drought, floods, weather, livestock disease, embargoes, tariffs and international economic, political and regulatory developments. Use of leveraged commodity-linked derivatives creates an opportunity for increased return but, at the same time, creates the possibility for greater loss.
Indices are unmanaged and investors cannot invest directly in an index. Unless otherwise noted, performance of indices does not account for any fees, commissions or other expenses that would be incurred. Returns do not include reinvested dividends.
The Standard & Poor's 500 (S&P 500) is an unmanaged group of securities considered to be representative of the stock market in general. It is a market value weighted index with each stock's weight in the index proportionate to its market value.
The Financial Times Stock Exchange 100 Index, also called the FTSE 100 Index, FTSE 100, FTSE, or, informally, the "Footsie" is a share index of the 100 companies listed on the London Stock Exchange with the highest market capitalization. It is seen as a gauge of prosperity for businesses regulated by UK company law.
The FTSE Developed Europe Index is an index of European stocks, part of the FTSE Global Equity Index Series. It is a subset of the FTSE Europe Index. The FTSE Eurobloc Index is a subset of it.
The MSCI Emerging Markets Index is a float-adjusted market capitalization index that consists of indices in 21 emerging economies: Brazil, Chile, China, Colombia, Czech Republic, Egypt, Hungary, India, Indonesia, Korea, Malaysia, Mexico, Morocco, Peru, Philippines, Poland, Russia, South Africa, Taiwan, Thailand, and Turkey.
The Bloomberg Barclays US Aggregate Bond Index, or the Agg, is a broad base, market capitalization-weighted bond market index representing intermediate term investment grade bonds traded in the United States. Investors frequently use the index as a stand-in for measuring the performance of the US bond market.
The US Dollar Index (USDX, DXY) is an index (or measure) of the value of the United States dollar relative to a basket of foreign currencies, often referred to as a basket of US trade partners' currencies.
The Consumer Price Index (CPI) is a measure of inflation compiled by the US Bureau of Labor Studies.
The Producer Price Index (PPI) is a family of indexes that measures the average change in selling prices received by domestic producers of goods and services over time. PPIs measure price change from the perspective of the seller.
Market Update: September 26 - 30, 2022

Economic Data Last Week
Core Personal Consumption Expenditures (PCE) Price Index
The Core PCE Price index is the Federal Reserve’s preferred inflation gauge. It increased 0.6% month over month in August, higher than the consensus expectation of 0.5%, and higher than last month’s increase of 0.0%. Year over year, the PCE price index increased 4.9%, the highest level since April of this year. The PCE report also shows personal spending increasing 0.4% in August, higher than the forecasted 0.2%. Real wages, that is earnings after adjusting for inflation, fell 2.75% year over year. Despite consumer incomes not keeping up with inflation, their spending has not slowed down. However, personal savings has been negatively impacted. The personal savings rate fell to 3.4% last week, its lowest level since 2007.
Initial Claims for Unemployment Insurance
Initial claims for unemployment insurance are used to measure the number of layoffs in the economy; as employees are laid off, they apply for unemployment insurance. For the week ending September 24, there were only 193,000 initial claims for unemployment insurance, the lowest level since April of this year. The four-week moving average initial claims fell for a fifth straight week. This is another sign that the labor market is still very strong. The jobs report last month showed that there are almost twice as many open jobs as there are people looking for work. The Bureau of Labor Statistics will release their monthly jobs report this Friday that will give an indication of whether the labor market has finally started to cool, though the recent data on unemployment insurance suggests that it hasn’t.
Equities
The S&P 500 fell to new year to date lows last week, amid continued fears that the Federal Reserve is hiking the economy into a recession. The S&P 500 fell 2.9% last week. The index is now down 23.9% year to date and lost 4.9% in the third quarter. This is the first time the S&P 500 has posted negative returns for three quarters in a row since 2009. The NASDAQ 100 also just posted negative returns for three quarters in a row, its first time since 2002 following the Dot Com Bubble.
Valuations in equities are starting to look much cheaper after being considered relatively expensive for the last several years. The forward P/E ratio measures the price of a stock divided by the 52-week forward consensus expectation earnings per share. It can be used to judge the confidence investors have in a stock or index. A high P/E ratio means investors are willing to pay more for a single dollar of earnings today because they expect a company’s earnings to grow in the future. The forward P/E Ratio on the S&P 500 is 15.31, lower than its ten-year average of 17.0.2 Small cap stocks, measured by the S&P 600, have a forward P/E of 10.7, levels not seen since the COVID pandemic drawdown in 2020 and the great financial crisis in 2008.1
Fixed Income
Interest rates remain volatile as investors anticipate an increasingly aggressive Federal Reserve. The ten-year Treasury rate got as high as 4% last week but ended the week lower at 3.8%. The U.S. Aggregate Bond Index is now down 16.3% from its all-time high set in August 2020.
Interest rates revolve around the market’s expectation of the Federal Reserve. The Fed has been very clear over the past several weeks that they are willing to cause economic pain to avoid inflation getting out of control. The recent economic data showing a strong labor market and persistent consumer spending reinforces the probability of them hiking rates another 75bps in November, which would bring the upper limit of the federal funds rate to 4.0%. The consensus in the markets as of today is for the target federal funds rate to end the year at 4.5%; however, expectations will most certainly adjust to new labor market and inflation reports for the remainder of the year.
Commodities
In a sign that the worst of inflation may be behind us, commodity prices have been consistently falling over the past several weeks. The Bloomberg Commodities index fell to its lowest level since February of 2022. Crude oil closed the week below $80 a barrel. This is the cheapest Crude has traded since January 2022, completely wiping out the large price increase following the Russian invasion of Ukraine.
Additionally, the price of lumber is 75% off its high set during the pandemic3. While the price of Aluminum4, Wheat, and Natural Gas, are all around 30% off their current cycle highs. These dramatic price reductions signal the disruptions caused by the pandemic are finally abating.
What to Watch for This Week
- The September Payroll report will be released on Friday. The consensus estimate is 250,000 new jobs added to the economy, down from last month’s report of 315,000. The unemployment rate is expected to remain at 3.7%.
- ISM Manufacturing PMI is reported on Monday, analysts expect a reading of 50.9 signaling an expansion in the manufacturing sector.
- Germany, France, and the Euro Area all report inflation this week.
Interesting Articles
Henry Grabar: Will Anyone Ever Buy or Sell a Home Again
References
- Yardeni Stock Market Briefing: Selected P/E Ratios
- FactSet Earnings Insight
- Trading Economics: Lumber
- Trading Economics: Aluminum
All data and figures in this article were collected from YCharts, Inc. on 10/03/2022 by Colin Bohne of Blue Ridge Wealth Planners unless otherwise cited.
This material represents an assessment of the market and economic environment at a specific point in time and is not intended to be a forecast of future events, or a guarantee of future results. Forward-looking statements are subject to certain risks and uncertainties. Actual results, performance, or achievements may differ materially from those expressed or implied. Information is based on data gathered from what we believe are reliable sources. It is not guaranteed as to accuracy, does not purport to be complete and is not intended to be used as a primary basis for investment decisions. It should also not be construed as advice visit the particular investment needs of any investor. Past performance does not guarantee future results.
Indices are unmanaged and investors cannot invest directly in an index. Unless otherwise noted, performance of indices does not account for any fees, commissions or other expenses that would be incurred. Returns do not include reinvested dividends.
The Standard & Poor's 500 (S&P 500) is an unmanaged group of securities considered to be representative of the stock market in general. It is a market value weighted index with each stock's weight in the index proportionate to its market value.
The Financial Times Stock Exchange 100 Index, also called the FTSE 100 Index, FTSE 100, FTSE, or, informally, the "Footsie" is a share index of the 100 companies listed on the London Stock Exchange with the highest market capitalization. It is seen as a gauge of prosperity for businesses regulated by UK company law.
Investments in emerging markets may be more volatile and less liquid than investing in developed markets and may involve exposure to economic structures that are generally less diverse and mature and to political systems which have less stability than those of more developed countries.
The MSCI Emerging Markets Index is a float-adjusted market capitalization index that consists of indices in 21 emerging economies: Brazil, Chile, China, Colombia, Czech Republic, Egypt, Hungary, India, Indonesia, Korea, Malaysia, Mexico, Morocco, Peru, Philippines, Poland, Russia, South Africa, Taiwan, Thailand, and Turkey.
The Bloomberg Barclays US Aggregate Bond Index, or the Agg, is a broad base, market capitalization-weighted bond market index representing intermediate term investment grade bonds traded in the United States. Investors frequently use the index as a stand-in for measuring the performance of the US bond market.
The US Dollar Index (USDX, DXY) is an index (or measure) of the value of the United States dollar relative to a basket of foreign currencies, often referred to as a basket of US trade partners' currencies.
The performance figures shown are gross of investment advisory fees and other expenses. The deduction of these management fees and expenses would reduce the overall return. Because fees are deducted quarterly, the compounding effect would be to increase the impact of the fee deduction on gross account performance by a greater percentage than that of the annual fee charged. For example, if an account is charged a 1% management fee per year and has gross performance of 12% during that same period, the compounding effect of the quarterly fee assessments will result in an actual return of approximately 10.9%.
The PCE price index (PCEPI), also referred to as the PCE deflator, PCE price deflator, or the Implicit Price Deflator for Personal Consumption Expenditures (IPD for PCE) by the BEA, and as the Chain-type Price Index for Personal Consumption Expenditures (CTPIPCE) by the Federal Open Market Committee (FOMC), is a United States-wide indicator of the average increase in prices for all domestic personal consumption. It is benchmarked to a base of 2012 = 100. Using a variety of data including U.S. Consumer Price Index and Producer Price Index prices, it is derived from the largest component of the GDP in the BEA's National Income and Product Accounts, personal consumption expenditures.
Investments in commodities may have greater volatility than investments in traditional securities, particularly if the instruments involve leverage. The value of commodity-linked derivative instruments may be affected by changes in overall market movements, commodity index volatility, changes in interest rates or factors affecting a particular industry or commodity, such as drought, floods, weather, livestock disease, embargoes, tariffs and international economic, political and regulatory developments. Use of leveraged commodity-linked derivatives creates an opportunity for increased return but, at the same time, creates the possibility for greater loss.
Smaller capitalization securities involve greater issuer risk than larger capitalization securities, and the markets for such securities may be more volatile and less liquid. Specifically, small capitalization companies may be subject to more volatile market movements than securities of larger, more established companies, both because the securities typically are traded in lower volume and because the issuers typically are more subject to changes in earnings and prospects.
The S&P 600 is an index of small-cap stocks managed by Standard and Poor's. It tracks a broad range of small-sized companies that meet specific liquidity and stability requirements. This is determined by specific metrics such as public float, market capitalization, and financial viability, among a few other factors.
Market Update: September 19 - 23, 2022

Economic Data Last Week
Existing Home Sales
There were a reported 4.8 million existing homes sold in August, down 0.4% from July and down 20% from August 2021. This is the seventh month in a row that existing home sales have dropped. Excluding the initial COVID pandemic decline, monthly home sales are now at their lowest level since 2014. In another sign that the housing market is slowing down, the amount of time it takes to sell a home has started to increase. A typical home spent 42 days on the market in August, which is 5 days longer than this time last year. This is still far faster than August 2019, where the average house took over 60 days to sell.1
The extreme volatility in mortgage rates has played a significant role in the slowdown in the housing market. The 30-year mortgage rate reached a high of 6.29% last week, its highest level since 2008 and much higher than its all-time low of 2.65% set just 19 months ago. In the last few years, many homeowners either purchased homes or refinanced at historically low interest rates. Selling their existing home to purchase a new home means getting a new mortgage at a much higher rate. Therefore, home buyers are forced to either downsize or pay a much higher monthly payment for an equally priced home. This is evident in Fannie Mae’s Home Purchase Sentiment Index, which fell to its lowest level since 2011 with 73% of respondents claiming now is a bad time to buy a home.2
Equities
The S&P 500 came very close to posting new year to date lows last week, falling over 4.5%. The S&P 500 is currently down 21.6%, only slightly better than its year to date low of 22.4% set in the middle of June. The 60/40 portfolio (60% in U.S. stocks and 40% in U.S. Bonds) is having one of its worst years on record, currently down 19% year to date. This is the worst start to the year since the beginning of the U.S. Aggregate Bond index in 1976.
Earnings season is virtually behind us with over 99% of S&P 500 companies having reported second quarter earnings numbers. Year over year aggregate earnings for S&P 500 companies grew 8.5%, led by the energy sector, which grew its earnings by nearly 300% from the second quarter of 2021.3
Fixed Income
The Federal Reserve hiked interest rates 75bps as expected, bringing the upper limit of the federal funds rate to 3.25%, the highest level in nearly 14 years. The markets reacted strongly to this, causing stocks to fall, interest rates to rise, and the value of the U.S. dollar to gain against a basket of major currencies. Markets expected the 75bps hike, but investors were surprised by the Fed’s outlook on interest rates and the economy moving forward. Shown in the “Summary of Economic Projections”, the consensus amongst Fed officials is a federal funds rate of 4.4% by the end of the year, which would mean hiking rates 5 more times this year (counting each 25bps increase as one hike).4 Fed officials have also attempted to be very clear in their last several public appearances that they don’t envision rate cuts in 2023, and the summary of projections shows that with a majority of officials envisioning rates between 4.5-5% in 2023.
The Fed has also been clear that it may take some economic hardship to bring inflation down significantly. Typically, the purpose of hiking interest rates is to slow an overheating economy by curbing demand, which usually results in job loss. The Fed’s goal is to slow the economy in such a way that inflation comes down to their target level with as little job loss as possible. However, in their summary of economic projections, they predict unemployment will increase to 4.4% in 2023, after projecting only 3.9% in their previous 2023 projections published in June.5 This signals that the Fed may be becoming less confident in their ability to pull off a “soft landing”.
The Fed visit resulted in U.S. Treasury rates continuing to increase at a rapid pace. The 2-year Treasury rate closed the week at 4.21% after gaining over 34bps, marking the first time since 2007 the rate has been over 4%. The yield curve remains severely inverted, with the 10-2 spread at negative 0.49%, very close to levels last seen before the bear market following the Dot Com Bubble. The U.S. Aggregate Bond index achieved new year to date lows last week with a drawdown of 15.5% from its all-time high set in August 2020. The U.S. Aggregate Bond Index is approaching its 26th month in a drawdown, much longer than the previous record of 15 months set in 1981.
What to Watch for This Week
- U.S. Durable Goods Orders: consensus is for a decrease of 1.1% after being flat in July.
- U.S. Core PCE Price Index: analysts currently expect a year over year rate of 4.7%, up from the 4.6% reported last month.
- Germany, France, and the Euro Area all report inflation this week.
Interesting Articles
Aziz Sunderji: Consumers Feel Worse Now Than They Did During Covid Lockdowns
Ben Carlson: How Long Does it Take For Stocks to Bottom in a Bear Market?
References
- Realtor.com: August 2022 Monthly Housing Market Trends Report
- Fannie Mae: National Housing Survey
- I/B/E/S data from Refinitiv
- Federal Reserve Summary of Economic Projections – September 2022
- Federal Reserve Summary of Economic Projections – June 2022
All data and figures in this article were collected from YCharts, Inc. on 9/26/2022 by Colin Bohne of Blue Ridge Wealth Planners unless otherwise cited.
This material represents an assessment of the market and economic environment at a specific point in time and is not intended to be a forecast of future events, or a guarantee of future results. Forward-looking statements are subject to certain risks and uncertainties. Actual results, performance, or achievements may differ materially from those expressed or implied. Information is based on data gathered from what we believe are reliable sources. It is not guaranteed as to accuracy, does not purport to be complete and is not intended to be used as a primary basis for investment decisions. It should also not be construed as advice visit the particular investment needs of any investor. Past performance does not guarantee future results.
Indices are unmanaged and investors cannot invest directly in an index. Unless otherwise noted, performance of indices does not account for any fees, commissions or other expenses that would be incurred. Returns do not include reinvested dividends.
The Standard & Poor's 500 (S&P 500) is an unmanaged group of securities considered to be representative of the stock market in general. It is a market value weighted index with each stock's weight in the index proportionate to its market value.
The Financial Times Stock Exchange 100 Index, also called the FTSE 100 Index, FTSE 100, FTSE, or, informally, the "Footsie" is a share index of the 100 companies listed on the London Stock Exchange with the highest market capitalization. It is seen as a gauge of prosperity for businesses regulated by UK company law.
Investments in emerging markets may be more volatile and less liquid than investing in developed markets and may involve exposure to economic structures that are generally less diverse and mature and to political systems which have less stability than those of more developed countries.
The MSCI Emerging Markets Index is a float-adjusted market capitalization index that consists of indices in 21 emerging economies: Brazil, Chile, China, Colombia, Czech Republic, Egypt, Hungary, India, Indonesia, Korea, Malaysia, Mexico, Morocco, Peru, Philippines, Poland, Russia, South Africa, Taiwan, Thailand, and Turkey.
The Bloomberg Barclays US Aggregate Bond Index, or the Agg, is a broad base, market capitalization-weighted bond market index representing intermediate term investment grade bonds traded in the United States. Investors frequently use the index as a stand-in for measuring the performance of the US bond market.
The US Dollar Index (USDX, DXY) is an index (or measure) of the value of the United States dollar relative to a basket of foreign currencies, often referred to as a basket of US trade partners' currencies.
The performance figures shown are gross of investment advisory fees and other expenses. The deduction of these management fees and expenses would reduce the overall return. Because fees are deducted quarterly, the compounding effect would be to increase the impact of the fee deduction on gross account performance by a greater percentage than that of the annual fee charged. For example, if an account is charged a 1% management fee per year and has gross performance of 12% during that same period, the compounding effect of the quarterly fee assessments will result in an actual return of approximately 10.9%.
Market Update: September 12 - 16, 2022

Economic Data Last Week
Consumer Price Index1
The Consumer Price Index (CPI) report was, as usual, the most anticipated release of the month. It showed August inflation increasing just 0.1%, bringing year over year inflation to 8.3%. The year over year report is lower than the current cycle high of 9.1% that was reported in June 2022, and it is lower than last month’s report of 8.5%. However, analysts had actually estimated aggregate prices would fall month over month, causing markets to react very negatively to the data.
Energy prices fell 5% in August, while the price of gasoline fell almost 11%. However, besides energy, there were few bright spots in the report. Food and shelter both increased almost a full percent and the price of new vehicles continued to increase despite the easing of supply chain constraints. Core CPI measures the rate of change in prices without including the volatile items that make up food and energy. Core CPI increased 0.6% in August, indicating that much of the low headline CPI (not core) report can be attributed to the large decrease in energy costs.
Inflation remains a global problem. The UK reported inflation last week at 9.9%, just off its current cycle high of 10.1%. Germany also released inflation numbers last week, showing annual inflation in August equal to its current cycle high of 7.9%.
U.S. Retail Sales2
The Retail Sales report measures the sale of retail goods and services in the United States over the period of one month. In August, retail sales grew 0.3% compared to analysts’ expectations of no growth at all. Investors are still anticipating signs showing a slowdown in consumer spending, but this report shows that despite negative real wage growth and low consumer sentiment, the consumer is still spending.
Equities
The S&P 500 continued its downward trend, closing the week down 4.8%, now only 6.1% above its year-to-date lows set on June 16. Most of last week’s losses came after the CPI report on Tuesday, where the S&P 500 lost over 4% and the Nasdaq 100 lost nearly 5.5% in a single trading session. The S&P 500 is now 18.4% off its all-time high set on January 3, 2022.
Amid global recession fears, 40-year high inflation, and aggressive central banks, fund managers remain very negative on the outlook for global equities. Bank of America conducted a survey of professional investment managers that found 62% of managers are overweight cash and 52% are underweight equities. In the history of the survey, this is the greatest percentage of investors reportedly overweight cash and it’s the highest percent of respondents claiming to be underweight equities since 2001.3,4
Fixed Income
U.S. Treasury rates increased dramatically following the hotter than expected inflation print. The two-year Treasury rate opened the week at 3.56% and closed at 3.86%, gaining almost 20bps on Tuesday alone. The two year is at its highest level since 2007 and has come a long way from its low of 0.09% set just 19 months ago. The yield curve remains inverted as the 10-2 spread is at negative 0.45%.
Stubbornly high inflation creates a domino effect in the markets. Hotter than anticipated inflation means the Federal Reserve might have to hike rates even more aggressively than previously expected. Higher interest rates in the world’s biggest economy attracts investment in U.S. Treasuries from global investors. More money coming to the U.S. from abroad combined with investors rushing to the safety of the U.S. dollar amid global recession fears, increases the value of the dollar relative to other currencies. The day after the inflation report, the pound dropped to its lowest level since 1985 and the value of the euro fell below parity, nearing its lowest level since 2002. A strong dollar can increase financing costs in emerging markets who borrow in dollars, as well as increase the total cost of commodities that are priced in dollars.
It is unclear how far the Federal Reserve will go with their rate increases, but as long as inflation lingers, fears of increasingly aggressive interest rate hikes will likely continue to escalate.
What to Watch for This Week
- The Federal Reserve meets on Wednesday to announce a rate hike decision. As of now, the consensus is for a 75bps hike, bringing the upper limit of the target Federal Funds rate to 3.25%.
- Canada and Japan report August inflation this week.
- The Bank of England and the Bank of Japan also meet this week for interest rate decisions.
Interesting Articles
Sam Ro: The stock market is not the economy in an important way
Ben Carlson: We’re Still in a Bear Market You Know
References
- https://www.bls.gov/news.release/pdf/cpi.pdf
- https://www.census.gov/retail/marts/www/marts_current.pdf
- https://www.reuters.com/markets/europe/super-bearish-fund-managers-allocation-global-stocks-all-time-low-bofa-survey-2022-09-13/
- https://www.bloomberg.com/news/articles/2022-09-13/bofa-survey-shows-nadir-in-stock-allocations-amid-recession-fear
All data and figures in this article were collected from YCharts, Inc. on 9/12/2022 by Colin Bohne of Blue Ridge Wealth Planners unless otherwise cited.
This material represents an assessment of the market and economic environment at a specific point in time and is not intended to be a forecast of future events, or a guarantee of future results. Forward-looking statements are subject to certain risks and uncertainties. Actual results, performance, or achievements may differ materially from those expressed or implied. Information is based on data gathered from what we believe are reliable sources. It is not guaranteed as to accuracy, does not purport to be complete and is not intended to be used as a primary basis for investment decisions. It should also not be construed as advice visit the particular investment needs of any investor. Past performance does not guarantee future results.
Indices are unmanaged and investors cannot invest directly in an index. Unless otherwise noted, performance of indices does not account for any fees, commissions or other expenses that would be incurred. Returns do not include reinvested dividends.
The Standard & Poor's 500 (S&P 500) is an unmanaged group of securities considered to be representative of the stock market in general. It is a market value weighted index with each stock's weight in the index proportionate to its market value.
The Financial Times Stock Exchange 100 Index, also called the FTSE 100 Index, FTSE 100, FTSE, or, informally, the "Footsie" is a share index of the 100 companies listed on the London Stock Exchange with the highest market capitalization. It is seen as a gauge of prosperity for businesses regulated by UK company law.
Investments in emerging markets may be more volatile and less liquid than investing in developed markets and may involve exposure to economic structures that are generally less diverse and mature and to political systems which have less stability than those of more developed countries.
The MSCI Emerging Markets Index is a float-adjusted market capitalization index that consists of indices in 21 emerging economies: Brazil, Chile, China, Colombia, Czech Republic, Egypt, Hungary, India, Indonesia, Korea, Malaysia, Mexico, Morocco, Peru, Philippines, Poland, Russia, South Africa, Taiwan, Thailand, and Turkey.
The Bloomberg Barclays US Aggregate Bond Index, or the Agg, is a broad base, market capitalization-weighted bond market index representing intermediate term investment grade bonds traded in the United States. Investors frequently use the index as a stand-in for measuring the performance of the US bond market.
The US Dollar Index (USDX, DXY) is an index (or measure) of the value of the United States dollar relative to a basket of foreign currencies, often referred to as a basket of US trade partners' currencies.
The Consumer Price Index (CPI) is a measure of inflation compiled by the US Bureau of Labor Studies.
The performance figures shown are gross of investment advisory fees and other expenses. The deduction of these management fees and expenses would reduce the overall return. Because fees are deducted quarterly, the compounding effect would be to increase the impact of the fee deduction on gross account performance by a greater percentage than that of the annual fee charged. For example, if an account is charged a 1% management fee per year and has gross performance of 12% during that same period, the compounding effect of the quarterly fee assessments will result in an actual return of approximately 10.9%.